This will be a very busy week for economic data. The key reports this week are September retail sales, September Industrial Production, August Case-Shiller house prices, October auto sales, and the ISM manufacturing index.
For prices, the September Producer Price and Consumer Price indexes will be released.
The ADP employment report will be released on Wednesday, however the BLS employment report for October has been delayed until the following week.
Also there will be an FOMC meeting on Tuesday and Wednesday, although no changes are expected.
----- Monday, October 28th -----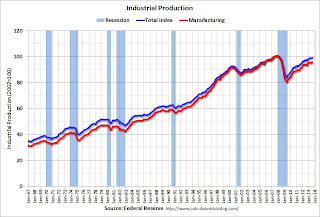
9:15 AM ET: The Fed is scheduled to release
Industrial Production and Capacity Utilization for September.
This graph shows industrial production since 1967.
The consensus is for a 0.4% increase in Industrial Production, and for Capacity Utilization to increase to 78.0%.
10:00 AM ET:
Pending Home Sales Index for September. The consensus is for a no change in the index.
10:30 AM:
Dallas Fed Manufacturing Survey for October. This is the last of the regional Fed surveys. The consensus is a reading of 9.0, up from 12.8 in September (above zero is expansion).
----- Tuesday, October 29th -----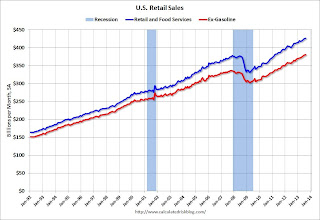
8:30 AM:
Retail sales for September.
This graph shows retail sales since 1992. This is monthly retail sales and food service, seasonally adjusted (total and ex-gasoline). Retail sales are up 28.7% from the bottom, and now 12.8% above the pre-recession peak (not inflation adjusted)
The consensus is for retail sales to be unchanged in September, and to increase 0.4% ex-autos.
8:30 AM:
Producer Price Index for September. The consensus is for a 0.2% increase in producer prices (0.1% increase in core).
9:00 AM:
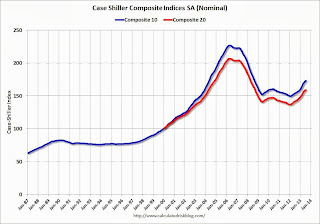
S&P/Case-Shiller House Price Index for August. Although this is the August report, it is really a 3 month average of June, July and August.
This graph shows the nominal seasonally adjusted Composite 10 and Composite 20 indexes through July 2012 (the Composite 20 was started in January 2000).
The consensus is for a 12.4% year-over-year increase in the Composite 20 index (NSA) for August. The
Zillow forecast is for the Composite 20 to increase 12.4% year-over-year, and for prices to increase 0.6% month-to-month seasonally adjusted.
10:00 AM:
Conference Board's consumer confidence index for October. The consensus is for the index to decrease to 75.0 from 79.7.
10:00 AM:
Manufacturing and Trade: Inventories and Sales (business inventories) report for August. The consensus is for a 0.3% increase in inventories.
----- Wednesday, October 30th -----7:00 AM: The Mortgage Bankers Association (MBA) will release the results for the
mortgage purchase applications index.
8:15 AM: The
ADP Employment Report for October. This report is for private payrolls only (no government). The consensus is for 138,000 payroll jobs added in October, down from 166,000 in September.
8:30 AM:
Consumer Price Index for September. The consensus is for a 0.2% increase in CPI in September and for core CPI to increase 0.2%.
2:00 PM:
FOMC Meeting Announcement. No change to interest rates or QE purchases is expected at this meeting.
----- Thursday, October 31st -----8:30 AM: The
initial weekly unemployment claims report will be released. The consensus is for claims to decrease to 335 thousand from 350 thousand last week.
9:45 AM:
Chicago Purchasing Managers Index for October. The consensus is for an increase to 55.0, up from 55.7 in September.
----- Friday, November 1st -----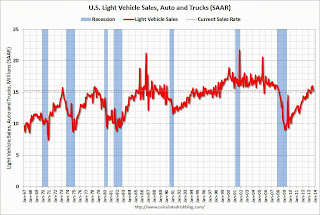
All day:
Light vehicle sales for October. The consensus is for light vehicle sales to increase to 15.4 million SAAR in October (Seasonally Adjusted Annual Rate) from 15.2 million SAAR in September.
This graph shows light vehicle sales since the BEA started keeping data in 1967. The dashed line is the September sales rate.
9:00 AM: The
Markit US PMI Manufacturing Index for October.
10:00 AM ET:
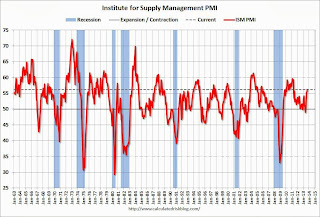
ISM Manufacturing Index for October. The consensus is for a decrease to 55.0 from 56.2 in September.
Here is a long term graph of the ISM manufacturing index.
The ISM manufacturing index indicated expansion in September at 56.2%. The employment index was at 55.4%, and the new orders index was at 60.5%.


.jpg)


