Happy Independence Day! The key report this week is the June employment report on Friday.
Other key reports include the ISM manufacturing index on Monday, auto sales on Tuesday, the Trade Balance report on Wednesday, and the ISM service index also on Wednesday.
Also Reis will release their Q2 2013 Mall vacancy rate survey this week.
----- Monday, July 1st -----9:00 AM: The
Markit US PMI Manufacturing Index for June. The consensus is for the index to be unchanged at 52.3.
10:00 AM ET:
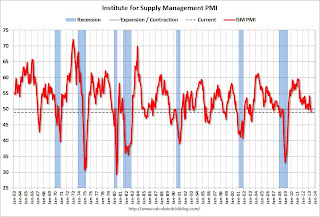
ISM Manufacturing Index for June. The consensus is for an increase to 50.5 from 49.0 in May. Based on the regional surveys, a reading above 50 seems likely.
Here is a long term graph of the ISM manufacturing index.
The ISM manufacturing index indicated contraction in May at 49.0%. The employment index was at 50.1%, down from 50.2%, and the new orders index was at 48.8%, down from 52.3% in April.
10:00 AM:
Construction Spending for May. The consensus is for a 0.6% increase in construction spending.
----- Tuesday, July 2nd -----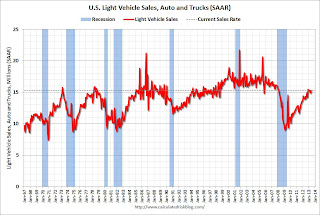
All day:
Light vehicle sales for June. The consensus is for light vehicle sales to increase to 15.5 million SAAR in June (Seasonally Adjusted Annual Rate) from 15.3 million SAAR in May.
This graph shows light vehicle sales since the BEA started keeping data in 1967. The dashed line is the May sales rate.
10:00 AM:
Manufacturers' Shipments, Inventories and Orders (Factory Orders) for May. The consensus is for a 2.0% increase in orders.
----- Wednesday, July 3rd -----7:00 AM: The Mortgage Bankers Association (MBA) will release the results for the
mortgage purchase applications index.
8:15 AM: The
ADP Employment Report for June. This report is for private payrolls only (no government). The consensus is for 165,000 payroll jobs added in June.
8:30 AM:
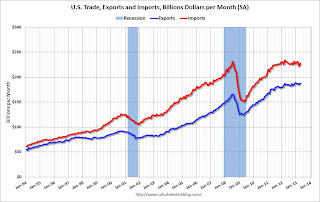
Trade Balance report for May from the Census Bureau.
The graphs shows both exports and imports increased in April, but have mostly been moving sideways.
The consensus is for the U.S. trade deficit to increase to $40.8 billion in May from $40.3 billion in April.
8:30 AM: The
initial weekly unemployment claims report will be released. The consensus is for a decrease to 345 thousand from 346 thousand last week.
10:00 AM:
ISM non-Manufacturing Index for June. The consensus is for a reading of 54.5, up from 53.7 in May. Note: Above 50 indicates expansion, below 50 contraction.
10:00 AM:
Trulia Price Rent Monitors for June. This is the index from Trulia that uses asking house prices adjusted both for the mix of homes listed for sale and for seasonal factors.
Early:
Reis Q2 2013 Mall Survey of rents and vacancy rates.
----- Thursday, July 4th -----All US markets are closed in observance of the
Independence Day holiday.
----- Friday, July 5th -----8:30 AM:
Employment Report for June. The consensus is for an increase of 161,000 non-farm payroll jobs in June; the economy added 175,000 non-farm payroll jobs in May.
The consensus is for the unemployment rate to decrease to 7.5% in June.
The following graph shows the percentage of payroll jobs lost during post WWII recessions through May.
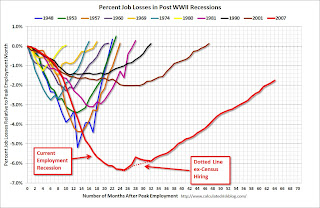
The economy has added 6.9 million private sector jobs since employment bottomed in February 2010 (6.3 million total jobs added including all the public sector layoffs).
There are still 1.9 million fewer private sector jobs now than when the recession started in 2007.


