If there is a government shutdown, the August construction spending report might not be released on Tuesday (it is probably already prepared, so it might be released even with a shutdown). The remaining reports Tuesday are all from private sources.
Tuesday:
• Early, Reis Q3 2013 Apartment Survey of rents and vacancy rates.
• At 9:00 AM ET, the Markit US PMI Manufacturing Index for September. The consensus is for the index to decrease to 52.9 from 53.1 in August.
• At 10:00 AM, the ISM Manufacturing Index for September. The consensus is for a decrease to 55.0 from 55.7 in August. The ISM manufacturing index was at 55.7% in August. The employment index was at 53.3%, and the new orders index was at 63.2%.
• Also at 10:00 AM, Construction Spending for August. The consensus is for a 0.4% increase in construction spending.
• At around 2:00 PM ET, Light vehicle sales for September will be released all day. The consensus is for light vehicle sales to decrease to 15.8 million SAAR in September (Seasonally Adjusted Annual Rate) from 16.0 million SAAR in August. I will post an estimate of September SAAR around 2 PM ET.
Monday, September 30, 2013
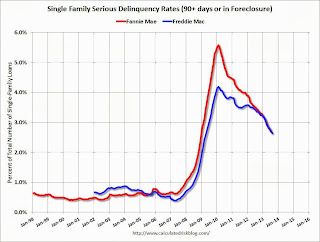
Fannie Mae: Mortgage Serious Delinquency rate declined in August, Lowest since December 2008
Fannie Mae reported today that the Single-Family Serious Delinquency rate declined in August to 2.61% from 2.70% in July. The serious delinquency rate is down from 3.44% in August 2012, and this is the lowest level since December 2008.
The Fannie Mae serious delinquency rate peaked in February 2010 at 5.59%.
Earlier Freddie Mac reported that the Single-Family serious delinquency rate declined in August to 2.64% from 2.70% in July. Freddie's rate is down from 3.36% in August 2012, and this is the lowest level since April 2009. Freddie's serious delinquency rate peaked in February 2010 at 4.20%.
Note: These are mortgage loans that are "three monthly payments or more past due or in foreclosure".
 Click on graph for larger image
The Fannie Mae serious delinquency rate has fallen 0.83 percentage points over the last year, and at that pace the serious delinquency rate will be under 1% in about 2 years. Note: The "normal" serious delinquency rate is under 1%.
Maybe serious delinquencies will be back to normal in late 2015 or 2016.
Preparing for the Partial Shutdown
From the WSJ: Agencies Prepare to Send Workers Home as Shutdown Looms
As we've discussed for some time, the deficit is declining rapidly (more short term cuts are bad policy right now) and public employment has fallen sharply over the last 4+ years (a significant drag). This is not helpful.
With the clock ticking and no budget deal in sight, federal agencies prepared to send more than 800,000 workers home without pay, and large swaths of the government were set to temporarily close.Bad policy, but the impact on the economy will be minimal if the shutdown is short.
...
Absent an agreement, workers who are furloughed will have to report to their agencies Tuesday morning for a half-day of preparations for the shutdown. Most will have up to four hours to wrap things up, and then be sent home until further notice.
Those who are deemed essential, or—in the language of government, "excepted"—will be guaranteed back pay after the fact. In past shutdowns, Congress has agreed to pay those furloughed as well, but given the cost-cutting zeitgeist of 2013, that was hardly guaranteed this time.
...
A Wall Street Journal review of agencies' shutdown plans found that more than 800,000 workers would be furloughed. In all, the federal government employs just under 2.9 million civilian employees.
As we've discussed for some time, the deficit is declining rapidly (more short term cuts are bad policy right now) and public employment has fallen sharply over the last 4+ years (a significant drag). This is not helpful.
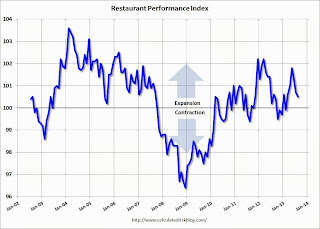
Restaurant Performance Index declines in August
From the National Restaurant Association: Restaurant Performance Index Edged Down in August Amid Fading Operator Expectations
 Click on graph for larger image.
The index declined to 100.5 in August from 100.7 in July. (above 100 indicates expansion).
Restaurant spending is discretionary, so even though this is "D-list" data, I like to check it every month.
Due to a softer outlook among restaurant operators for sales growth and the economy, the National Restaurant Association’s Restaurant Performance Index (RPI) declined for the third consecutive month. The RPI – a monthly composite index that tracks the health of and outlook for the U.S. restaurant industry – stood at 100.5 in August, down 0.2 percent from July’s level of 100.7. Despite the recent declines, the RPI remained above 100 for the sixth consecutive month, which signifies expansion in the index of key industry indicators.
“The August decline in the RPI was due almost entirely to a dip in the expectations indicators, with restaurant operators becoming less bullish about sales growth and the economy in the months ahead,” said Hudson Riehle, senior vice president of the Research and Knowledge Group for the Association.
“In contrast, operators reported positive same-store sales and customer traffic levels in August, and a majority of operators reported capital expenditures for the fourth consecutive month,” Riehle added.
...
The Current Situation Index, which measures current trends in four industry indicators (same-store sales, traffic, labor and capital expenditures), stood at 100.7 in August – up 0.6 percent from July and the first increase in three months. In addition, the Current Situation Index stood above 100 for the fifth consecutive month, which signifies expansion in the current situation indicators.
A majority of restaurant operators reported positive same-store sales in August, and the overall results were an improvement over July’s performance. ... Restaurant operators also reported stronger customer traffic levels in August.
emphasis added
 Click on graph for larger image.
The index declined to 100.5 in August from 100.7 in July. (above 100 indicates expansion).
Restaurant spending is discretionary, so even though this is "D-list" data, I like to check it every month.
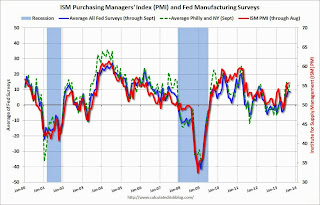
Dallas Fed: "Texas Manufacturing Activity Picks Up"
From the Dallas Fed: Texas Manufacturing Activity Picks Up
 Click on graph for larger image.
The New York and Philly Fed surveys are averaged together (dashed green, through September), and five Fed surveys are averaged (blue, through September) including New York, Philly, Richmond, Dallas and Kansas City. The Institute for Supply Management (ISM) PMI (red) is through August (right axis).
Most of the regional surveys showed expansion in September (Richmond was at zero), and overall at about the same pace as in August. The ISM index for September will be released tomorrow, October 1st.
Texas factory activity expanded in September, according to business executives responding to the Texas Manufacturing Outlook Survey. The production index, a key measure of state manufacturing conditions, rose from 7.3 to 11.5, suggesting output increased at a slightly faster pace than in August. ... Perceptions of broader business conditions improved further in September. The general business activity index jumped nearly 8 points to 12.8, its highest reading in a year and a half.Here is a graph comparing the regional Fed surveys and the ISM manufacturing index:
The new orders index was 5, largely unchanged from its August level. ... Labor market indicators reflected continued employment growth but flat workweeks. The September employment index was 10, its third reading in a row in solidly positive territory.
...
Expectations regarding future business conditions remained optimistic in September. The indexes of future general business activity and future company outlook showed mixed movements but remained in strongly positive territory. Indexes for future manufacturing activity also remained solidly positive, and the index for future employment spiked 10 points to 21.9.
emphasis added
 Click on graph for larger image.
The New York and Philly Fed surveys are averaged together (dashed green, through September), and five Fed surveys are averaged (blue, through September) including New York, Philly, Richmond, Dallas and Kansas City. The Institute for Supply Management (ISM) PMI (red) is through August (right axis).
Most of the regional surveys showed expansion in September (Richmond was at zero), and overall at about the same pace as in August. The ISM index for September will be released tomorrow, October 1st.
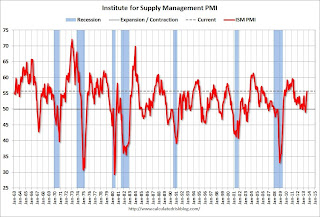
Chicago PMI increases to 55.7
From the Chicago ISM:
September 2013:
September 2013:
Led by gains in Production, New Orders and Supplier Deliveries, the Chicago Business BarometerTM gained 2.7 points in September to 55.7.This was above the consensus estimate of 54.0.
The Barometer has gained in each of the past three months, the longest run of monthly increases for more than three years. Activity has recovered from April’s three year low of 49.0, although is still only consistent with modest economic growth.
...
New Orders were up for the second consecutive month to the highest level since February. ...Employment softened for the third consecutive month and was the only barometer component to fall in September. Inventories continued to contract and Prices Paid fell substantially after rising in the past four months.
Commenting on the MNI Chicago Report, Philip Uglow, Chief Economist at MNI Indicators said, “Activity picked-up again in September close to trend supported by New Orders and Production.”
“While the pick-up is welcomed, growth is far from solid. The easing in the employment component is a notable setback this month, underlying the fragility of the recovery,” he added.
Sunday, September 29, 2013
Exporting: The Definitive Guide to Selling Abroad Profitably
 |
| Book cover courtesy Apress |
Exporting: The Definitive Guide to Selling Abroad Profitably
Sunday Night Futures: Government Shutdown Very Possible
It seems likely that the House will shutdown the government Monday night. From the NY Times:
Monday:
• 9:45 AM ET, the Chicago Purchasing Managers Index for September. The consensus is for an increase to 54.4, up from 53.0 in August.
• At 10:30 AM, the Dallas Fed Manufacturing Survey for September. This is the last of the regional manufacturing surveys for September. The consensus is a reading of 6.0, up from the reading of 5.0 in August (above zero is expansion).
Weekend:
• Schedule for Week of September 29th
• Q3 Review: Ten Economic Questions for 2013
The Nikkei is down about 2.0%.
From CNBC: Pre-Market Data and Bloomberg futures: the S&P futures are down 12 and DOW futures are down 100 (fair value).
The Senate is expected to reject decisively a House bill passed over the weekend that would delay the full effect of President Obama’s health care law as a condition for keeping the government running past Monday, as Senator Harry Reid, the Democratic majority leader, expressed confidence that he had public opinion on his side.If the House does shutdown the government, people will forget before the next election - as long as any shutdown is short. (Not to be confused with not "paying the bills" or "debt ceiling" - refusing to pay the bills would never be forgotten).
...
Polls show that the public is already deeply unhappy with its leaders in Congress, and the prospect of the first government shutdown in 17 years would be the latest dispiriting development.
Monday:
• 9:45 AM ET, the Chicago Purchasing Managers Index for September. The consensus is for an increase to 54.4, up from 53.0 in August.
• At 10:30 AM, the Dallas Fed Manufacturing Survey for September. This is the last of the regional manufacturing surveys for September. The consensus is a reading of 6.0, up from the reading of 5.0 in August (above zero is expansion).
Weekend:
• Schedule for Week of September 29th
• Q3 Review: Ten Economic Questions for 2013
The Nikkei is down about 2.0%.
From CNBC: Pre-Market Data and Bloomberg futures: the S&P futures are down 12 and DOW futures are down 100 (fair value).
Gasoline Prices down 35 cents per gallon year-over-year
Gasoline prices are down about 35 cents year-over-year at $3.42 per gallon nationally.
Some of the year-over-year price decline is related to slightly lower Brent oil prices, but most of decline is because there were refinery and pipeline issues last year at this time. In California, prices spiked last September, and are down about 80 cents year-over-year this September (put Los Angeles into the graph below to see the huge spike last year).
Prices are close to the current EIA forecast (from two weeks ago):
The following graph is from Gasbuddy.com. Note: If you click on "show crude oil prices", the graph displays oil prices for WTI, not Brent.
Some of the year-over-year price decline is related to slightly lower Brent oil prices, but most of decline is because there were refinery and pipeline issues last year at this time. In California, prices spiked last September, and are down about 80 cents year-over-year this September (put Los Angeles into the graph below to see the huge spike last year).
Prices are close to the current EIA forecast (from two weeks ago):
Monthly average crude oil prices increased for the fourth consecutive month in August 2013, as supply disruptions in Libya increased and concerns over the conflict in Syria intensified. The U.S. Energy Information Administration's (EIA) forecast for Brent crude oil spot price, which averaged $108 per barrel during the first half of 2013, averages $109 per barrel over the second half of 2013 and $102 per barrel in 2014, $5 per barrel and $2 per barrel higher than forecast in last month's STEO, respectively. Projected West Texas Intermediate (WTI) crude oil prices average $101 per barrel during the fourth quarter of 2013 and $96 per barrel during 2014. Energy price forecasts are highly uncertain and could differ significantly from the projected levels. The current values of futures and options contracts suggest the lower and upper limits of the 95% confidence interval for the market's expectations of monthly average WTI prices in December 2013 at $86 per barrel and $131 per barrel, respectively.WTI oil prices have been declining over the last month, with WTI at $102.87 per barrel. Brent is at $108.63. A year ago, WTI was in the low $90s, and Brent was around $111 per barrel.
...
EIA's forecast for the regular gasoline retail price averages $3.44 per gallon in the fourth quarter of 2013, 11 cents per gallon higher than in last month's STEO. The annual average regular gasoline retail, which was $3.63 per gallon in 2012, is expected to be $3.55 per gallon in 2013 and $3.43 per gallon in 2014. As in the case of crude oil, the current value of futures and options contracts suggests a wide uncertainty in market expectations.
emphasis added
The following graph is from Gasbuddy.com. Note: If you click on "show crude oil prices", the graph displays oil prices for WTI, not Brent.
| Orange County Historical Gas Price Charts Provided by GasBuddy.com |
Q3 Review: Ten Economic Questions for 2013
At the end of last year, I posted Ten Economic Questions for 2013. I followed up with a brief post on each question. The goal was to provide an overview of what I expected in 2013 (I don't have a crystal ball, but I think it helps to outline what I think will happen - and understand when I was wrong).
By request, here is a Q3 review. I've linked to my posts from the beginning of the year, with a brief excerpt and a few comments:
10) Question #10 for 2013: Europe and the Euro
9) Question #9 for 2013: How much will Residential Investment increase?
8) Question #8 for 2013: Will Housing inventory bottom in 2013?
7) Question #7 for 2013: What will happen with house prices in 2013?
6) Question #6 for 2013: What will happen with Monetary Policy and QE3?
5) Question #5 for 2013: Will the inflation rate rise or fall in 2013?
4) Question #4 for 2013: What will the unemployment rate be in December 2013?
3) Question #3 for 2013: How many payroll jobs will be added in 2013?
2) Question #2 for 2013: Will the U.S. economy grow in 2013?
1) Question #1 for 2013: US Fiscal Policy
Fiscal policy (specifically the U.S. House) remains the key downside risk for the U.S. economy this year. We might see a government shutdown on Tuesday, and the House is once again threatening to not "pay-the-bills" starting in mid-October (I expect the House to fold again and "pay-the-bills"). Luckily 2014 is an election year, and the House will not pull these stunts again next year!
Overall 2013 is unfolding about as expected. Longer term, the future's so bright ...
By request, here is a Q3 review. I've linked to my posts from the beginning of the year, with a brief excerpt and a few comments:
10) Question #10 for 2013: Europe and the Euro
Even though I've been pessimistic on Europe (In 2011, I correctly argued that the eurozone was heading into recession), I was less pessimistic than many others. Each of the last two years, I argued the eurozone would stay together ... My guess is the eurozone makes it through another year without losing any countries or a serious collapse. Obviously several countries are near the edge, and the key will be to return to expansion soon.Three quarters of the way through 2013, it definitely looks like the Eurozone will stay together this year. Of course the news in Europe remains grim, although there has been a little bit of growth recently. It is now obvious to everyone that "austerity" alone failed (except for some blind policymakers). Hopefully there will be less fiscal tightening now that German Chancellor Angela Merkel has been reelected.
Note: unless the eurozone "implodes", I don't think Europe poses a large downside risk to the US. If there is a breakup of the euro (something I do not expect in 2013), then the impact on the US could be significant due to financial tightening.
9) Question #9 for 2013: How much will Residential Investment increase?
New home sales will still be competing with distressed sales (short sales and foreclosures) in many areas in 2013 - and probably even more foreclosures in some judicial states. Also I've heard some builders might be land constrained in 2013 (not enough finished lots in the pipeline). Both of these factors could slow the growth of residential investment, but I expect another solid year of growth.We have data through August, and starts this year are up 23% over the same period in 2012. However the year-over-year increases have slowed recently, but it still appears starts will be up significantly in 2013. New home sales are up 20% through the first eight months of 2013 compared to the same period in 2012. The year-over-year increase for new home sales have slowed too, but sales should be up close to 20% this year.
... I expect growth for new home sales and housing starts in the 20% to 25% range in 2013 compared to 2012.
8) Question #8 for 2013: Will Housing inventory bottom in 2013?
If prices increase enough then some of the potential sellers will come off the fence, and some of these underwater homeowners will be able to sell. It might be enough for inventory to bottom in 2013.I track inventory weekly, and the year-over-year rate of decline has slowed sharply. My guess is that inventory did bottom in January 2013 (this should be a huge focus right now, since rising inventory will slow price increases).
Right now my guess is active inventory will bottom in 2013, probably in January. At the least, the rate of year-over-year inventory decline will slow sharply.
7) Question #7 for 2013: What will happen with house prices in 2013?
Calling the bottom for house prices in 2012 now appears correct.The Case-Shiller Comp 20 and National indexes both increased about 7% in 2012. The seasonally adjusted Case-Shiller Comp 20 index is up 8.5% through July, and the National Index is up 6.2% through Q2 . I expect price increases to slow, but my initial prediction for house prices this year was too low.
[E]ven though I expect inventories to be low this year, I think we will see more inventory come on the market in 2013 than 2012, as sellers who were waiting for a better market list their homes, and as some "underwater" homeowner (those who owe more than their homes are worth) finally can sell without taking a loss.
Also I expect more foreclosure in some judicial states, and I think the price momentum in Phoenix and other "bounce back" areas will slow.
All of these factors suggest further prices increases in 2013, but at a slower rate than in 2012.
6) Question #6 for 2013: What will happen with Monetary Policy and QE3?
I expect the FOMC will review their purchases at each meeting just like they used to review the Fed Funds rate. We might see some adjustments during the year, but currently I expect the Fed to purchase securities at about the same level all year.This still seems about right, however the Fed might start to taper this month or in December. This depends on both incoming and the House of Representatives passing a Continuing Resolution (without absurd demands) and also agreeing to "pay the bills". The House remains the biggest downside risk for the U.S. economy (see Question #1).
5) Question #5 for 2013: Will the inflation rate rise or fall in 2013?
I still expect inflation to be near the Fed's target. With high unemployment and low resource utilization, I don't see inflation as a threat in 2013.Inflation has been below the Fed's target all year. This is a significant issue for the Fed, and it appears my inflation forecast was a little high.
4) Question #4 for 2013: What will the unemployment rate be in December 2013?
My guess is the participation rate will remain around 63.6% in 2013, and with sluggish employment growth, the unemployment rate will be in the mid-to-high 7% range in December 2013 (little changed from the current rate).In August, the participation rate was at 63.2% (I was expecting the participation rate to move sideways this year at around 63.6%), and the unemployment rate was at 7.3%, down from 7.8% in December 2012. I was too pessimistic on the unemployment rate because the participation rate has continued to decline.
3) Question #3 for 2013: How many payroll jobs will be added in 2013?
Both state and local government and construction hiring should improve in 2013. Unfortunately there are other employment categories that will be hit by the austerity (especially the increase in payroll taxes). I expect that will offset any gain from construction and local governments. So my forecast is close to the previous two years, a gain of about 150,000 to 200,000 payroll jobs per month in 2013.Through August 2013, the economy has added an average of 180 thousand jobs per month - about as expected.
2) Question #2 for 2013: Will the U.S. economy grow in 2013?
[R]ight now it appears the drag from austerity will probably offset the pickup in the private sector - and we can expect another year of sluggish growth in 2013 probably in the 2% range again.The economy grew at a 1.8% annualized rate in the first half of 2013. This is about what I expected, however there was more austerity than I expected (sequester).
1) Question #1 for 2013: US Fiscal Policy
[T]the House will fold their [early 2013] losing hand [on the debt ceiling] soon. ...The House did fold early this year, but I was wrong about the sequester (bad policy). But I was definitely correct about the deficit decreasing faster than most people expected. This has really surprised some policymakers (who unfortunately are still ignoring the sharp decline).
Although the negotiations on the "sequester" will be tough, I suspect something will be worked out (remember the goal is to limit the amount of austerity in 2013). The issue that might blow up is the “continuing resolution", and that might mean a partial shut down of the government. This wouldn't be catastrophic (like the "debt ceiling"), but it would still cause problems for the economy and is a key downside risk.
And a final prediction: If we just stay on the current path ... I think the deficit will decline faster than most people expect over the next few years. Eventually the deficit will start to increase again due to rising health care costs (this needs further attention), but that isn't a short term emergency.
Fiscal policy (specifically the U.S. House) remains the key downside risk for the U.S. economy this year. We might see a government shutdown on Tuesday, and the House is once again threatening to not "pay-the-bills" starting in mid-October (I expect the House to fold again and "pay-the-bills"). Luckily 2014 is an election year, and the House will not pull these stunts again next year!
Overall 2013 is unfolding about as expected. Longer term, the future's so bright ...
Saturday, September 28, 2013
Unofficial Problem Bank list declines to 690 Institutions
This is an unofficial list of Problem Banks compiled only from public sources.
Here is the unofficial problem bank list for September 27, 2013.
Changes and comments from surferdude808:
Here is the unofficial problem bank list for September 27, 2013.
Changes and comments from surferdude808:
The FDIC broke its reporting pattern by not releasing its enforcement action activity for the previous month on the last Friday of the current month. Guess we will get it next week. Otherwise, there two removals during the week that leave the Unofficial Problem Bank list with 690 institutions and $240.5 billion of assets. A year ago, the list held 874 institutions with $335 billion of assets. During the month of September 2013, the list dropped by a net 17 institutions after 14 action terminations, two unassisted mergers, two failures, and one addition. Assets fell by $10.2 billion, which made was the third consecutive month for the list to shrink by more than $10 billion. It may be challenging for the monthly asset removal rate to stay above $10 billion as the average size of institutions on the list has fallen to $349 million. Thus, about 28 institutions would need removal while the average monthly removal rate for the past year is 23 institutions.
The removals this week were Seacoast National Bank, Stuart, FL ($2.2 billion Ticker: SBCF) and A J Smith Federal Savings Bank, Midlothian, IL ($216 million).
During the month, the Treasury Department issued its five-year update report on TARP. A total of 119 institutions still have not repaid capital infused under TARP including 57 institutions on the Unofficial Problem Bank List. Of the institutions on the Unofficial Problem bank List, there are 50 that have missed 10 or more quarterly payments. See the table for additional details (excel file).
Supposedly, only healthy banks were eligible for an infusion of capital through the various TARP programs. This week, the Wall Street Journal (Some Smaller Banks Still Owe TARP Money) highlighted the difficulties of many banks to exit TARP and this "undercut the insistence of government officials at the height of the crisis that taxpayer dollars would only be steered toward healthy, viable banks." More than 25 banking organizations that received TARP have failed or filed for bankruptcy protection. After five years, the dividend rate on TARP preferred shares rises from 5% to 9%. In the fourth quarter of 2013, the dividend rate will increase for 13 institutions on the Unofficial Problem Bank List. Most likely, the dividend increase will accelerate the resolution status of these institutions.
Next week, we look for the FDIC to release its actions through August 2013. If so, we will update the quarterly transition matrix. There is nothing new to pass along on Capitol Bancorp, Ltd.
Freddie Mac: Mortgage Serious Delinquency rate declined in August, Lowest since April 2009
Freddie Mac reported that the Single-Family serious delinquency rate declined in August to 2.64% from 2.70% in July. Freddie's rate is down from 3.36% in August 2012, and this is the lowest level since April 2009. Freddie's serious delinquency rate peaked in February 2010 at 4.20%.
These are mortgage loans that are "three monthly payments or more past due or in foreclosure".
I'm frequently asked when the distressed sales will be back to normal levels, and that will happen when the percent of seriously delinquent loans (and in foreclosure) is closer to normal. Since very few seriously delinquent loans cure with the owner making up back payments - most of the reduction in the serious delinquency rate is from foreclosures, short sales, and modifications.
Note: Fannie Mae will report their Single-Family Serious Delinquency rate for August next week.
 Click on graph for larger image
Although this indicates some progress, the "normal" serious delinquency rate is under 1%.
At the recent rate of improvement, the serious delinquency rate will not be under 1% until 2016 or so. Therefore I expect a fairly high level of distressed sales for 2 to 3 more years (mostly in judicial states).
Schedule for Week of September 29th
Special Note: If Congress partially shuts down the government on Tuesday, some economic data will be delayed including the employment report.
The key report this week is the September employment report on Friday.
Other key reports include the ISM manufacturing report on Tuesday, September auto sales also on Tuesday, and the ISM non-manufacturing report on Thursday.
Also Reis is scheduled to release their Q3 surveys for apartments, offices and malls.
----- Monday, September 30th -----
9:45 AM ET: Chicago Purchasing Managers Index for September. The consensus is for an increase to 54.4, up from 53.0 in August.
10:30 AM: Dallas Fed Manufacturing Survey for September. This is the last of the regional manufacturing surveys for September. The consensus is a reading of 6.0, up from the reading of 5.0 in August (above zero is expansion).
----- Tuesday, October 1st -----
Early: Reis Q3 2013 Apartment Survey of rents and vacancy rates.
9:00 AM: The Markit US PMI Manufacturing Index for September. The consensus is for the index to decrease to 52.9 from 53.1 in August.
 10:00 AM ET: ISM Manufacturing Index for September. The consensus is for a decrease to 55.0 from 55.7 in August.
Here is a long term graph of the ISM manufacturing index.
The ISM manufacturing index was at 55.7% in August. The employment index was at 53.3%, and the new orders index was at 63.2%.
10:00 AM: Construction Spending for August. The consensus is for a 0.4% increase in construction spending.
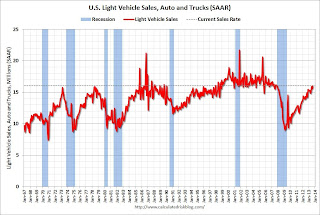 All day: Light vehicle sales for September. The consensus is for light vehicle sales to decrease to 15.8 million SAAR in August (Seasonally Adjusted Annual Rate) from 16.0 million SAAR in August.
This graph shows light vehicle sales since the BEA started keeping data in 1967. The dashed line is the August sales rate.
----- Wednesday, October 2nd -----
Early: Reis Q3 2013 Office Survey of rents and vacancy rates.
7:00 AM: The Mortgage Bankers Association (MBA) will release the results for the mortgage purchase applications index.
8:15 AM: The ADP Employment Report for September. This report is for private payrolls only (no government). The consensus is for 175,000 payroll jobs added in September, down from 176,000 in August.
3:30 PM: Speech by Fed Chairman Ben S. Bernanke, Brief Welcoming Remarks, At the Federal Reserve/Conference of State Bank Supervisors Community Banking Research Conference, Federal Reserve Bank of St. Louis
----- Thursday, October 3rd -----
Early: Reis Q3 2013 Mall Survey of rents and vacancy rates.
8:30 AM: The initial weekly unemployment claims report will be released. The consensus is for claims to increase to 313 thousand from 305 thousand last week.
10:00 AM: ISM non-Manufacturing Index for September. The consensus is for a reading of 57.0, down from 58.6 in August. Note: Above 50 indicates expansion, below 50 contraction.
10:00 AM: Manufacturers' Shipments, Inventories and Orders (Factory Orders) for August. The consensus is for a 0.2% increase in orders.
10:00 AM: Trulia Price Rent Monitors for September. This is the index from Trulia that uses asking house prices adjusted both for the mix of homes listed for sale and for seasonal factors.
----- Friday, October 4th -----
8:30 AM: Employment Report for September. The consensus is for an increase of 178,000 non-farm payroll jobs in September; the economy added 169,000 non-farm payroll jobs in August.
The consensus is for the unemployment rate to be unchanged at 7.3% in September.
The following graph shows the percentage of payroll jobs lost during post WWII recessions through July.
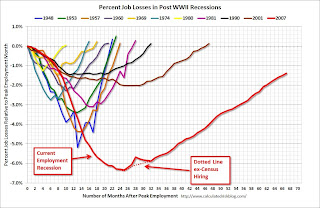 The economy has added 7.5 million private sector jobs since employment bottomed in February 2010 (6.8 million total jobs added including all the public sector layoffs).
There are still 1.4 million fewer private sector jobs now than when the recession started in 2007.
The key report this week is the September employment report on Friday.
Other key reports include the ISM manufacturing report on Tuesday, September auto sales also on Tuesday, and the ISM non-manufacturing report on Thursday.
Also Reis is scheduled to release their Q3 surveys for apartments, offices and malls.
9:45 AM ET: Chicago Purchasing Managers Index for September. The consensus is for an increase to 54.4, up from 53.0 in August.
10:30 AM: Dallas Fed Manufacturing Survey for September. This is the last of the regional manufacturing surveys for September. The consensus is a reading of 6.0, up from the reading of 5.0 in August (above zero is expansion).
Early: Reis Q3 2013 Apartment Survey of rents and vacancy rates.
9:00 AM: The Markit US PMI Manufacturing Index for September. The consensus is for the index to decrease to 52.9 from 53.1 in August.
 10:00 AM ET: ISM Manufacturing Index for September. The consensus is for a decrease to 55.0 from 55.7 in August.
 Here is a long term graph of the ISM manufacturing index.
The ISM manufacturing index was at 55.7% in August. The employment index was at 53.3%, and the new orders index was at 63.2%.
10:00 AM: Construction Spending for August. The consensus is for a 0.4% increase in construction spending.
 All day: Light vehicle sales for September. The consensus is for light vehicle sales to decrease to 15.8 million SAAR in August (Seasonally Adjusted Annual Rate) from 16.0 million SAAR in August.
This graph shows light vehicle sales since the BEA started keeping data in 1967. The dashed line is the August sales rate.
Early: Reis Q3 2013 Office Survey of rents and vacancy rates.
7:00 AM: The Mortgage Bankers Association (MBA) will release the results for the mortgage purchase applications index.
8:15 AM: The ADP Employment Report for September. This report is for private payrolls only (no government). The consensus is for 175,000 payroll jobs added in September, down from 176,000 in August.
3:30 PM: Speech by Fed Chairman Ben S. Bernanke, Brief Welcoming Remarks, At the Federal Reserve/Conference of State Bank Supervisors Community Banking Research Conference, Federal Reserve Bank of St. Louis
Early: Reis Q3 2013 Mall Survey of rents and vacancy rates.
8:30 AM: The initial weekly unemployment claims report will be released. The consensus is for claims to increase to 313 thousand from 305 thousand last week.
10:00 AM: ISM non-Manufacturing Index for September. The consensus is for a reading of 57.0, down from 58.6 in August. Note: Above 50 indicates expansion, below 50 contraction.
10:00 AM: Manufacturers' Shipments, Inventories and Orders (Factory Orders) for August. The consensus is for a 0.2% increase in orders.
10:00 AM: Trulia Price Rent Monitors for September. This is the index from Trulia that uses asking house prices adjusted both for the mix of homes listed for sale and for seasonal factors.
8:30 AM: Employment Report for September. The consensus is for an increase of 178,000 non-farm payroll jobs in September; the economy added 169,000 non-farm payroll jobs in August.
The consensus is for the unemployment rate to be unchanged at 7.3% in September.
The following graph shows the percentage of payroll jobs lost during post WWII recessions through July.
 The economy has added 7.5 million private sector jobs since employment bottomed in February 2010 (6.8 million total jobs added including all the public sector layoffs).
There are still 1.4 million fewer private sector jobs now than when the recession started in 2007.
Pretty Pittsburgh!
 |
| ©2013 Laurel Delaney. All rights reserved. |
Meanwhile, watch for the announcement of my new exporting book on Monday, September 30th! And don't forget to sign up for tips (email address) and pre-order through Amazon, Barnes & Noble or Apress! Thanks!
Have a good weekend!
Friday, September 27, 2013
Report: Employment Report to be delayed if Government Shutdown
A week ago I was wondering about this ...
From Reuters: Labor Dept says U.S. jobs report would be delayed by shutdown
From Reuters: Labor Dept says U.S. jobs report would be delayed by shutdown
The U.S. Labor Department said in a memo on Friday it would not issue its closely-watched monthly employment report next week should the government shut down on Monday.A partial shutdown is dumb, disruptive and costs money (no money is saved). A shutdown is very possible (it would start on Tuesday Oct 1st). But even with a shutdown, I'm confident Congress will pay the bills (aka raise "debt ceiling").
"All survey and other program operations will cease and the public website will not be updated," Erica Groshen, the commissioner of the Bureau of Labor Statistics, said in a memo published on the department's website.
...
A separate memo from the Labor Department said the government's weekly jobless claims report, which is due on Thursday, would not be affected.
Vehicle Sales: Likely Weaker Sales in September
Note: The automakers will report September vehicle sales Tuesday, Oct 1st.
According the Bureau of Economic Analysis (BEA), light vehicle sales in August were at a 16.0 million rate, on a seasonally adjusted annual rate (SAAR) basis. It looks like September sales will be somewhat softer.
Here are a few forecasts:
From Kelley Blue Book: September Auto Sales Expected To Dip 2 Percent, According To Kelley Blue Book
"September 2013 new-vehicle sales represent the first year-over-year drop since May 2011, due to slower retail sales, two fewer sales days in the month, and this year's Labor Day sales included in August 2013 totals," said Alec Gutierrez, senior analyst at Kelley Blue Book. ...From JD Power: Strong Labor Day Weekend Sales Pull Deliveries from September
The seasonally adjusted annual rate (SAAR) for September 2013 is estimated to be 15.7 million, up from 14.7 million in September 2012 and down from 16.0 million in August 2013.
Based on analysis of sales during the first two weeks of the month, new-vehicle sales are likely to reach nearly 1.33 million units, but may be weaker than in recent months due to strong Labor Day weekend sales that were tallied with August's robust sales totals.From TrueCar: September 2013 New Car Sales Expected to Be Down 4.4 Percent According to TrueCar; September 2013 SAAR at 15.4M
"Although the year-over-year sales gain in September is smaller than has been observed in recent months, it's important to recognize that September reported sales are being heavily influenced by the [Labor Day weekend] quirk in the sales calendar," said John Humphrey, senior vice president of the global automotive practice at J.D. Power.
For September 2013, new light vehicle sales in the U.S. (including fleet) is expected to be 1,131,333 units, down 4.4 percent from September 2012 and also down 24.5% percent from August 2013 (on an unadjusted basis – September 2013 had 23 sales days, compared to 25 in September 2012).The analyst consensus is for sales of 16.0 million SAAR in September.
The September 2013 forecast translates into a Seasonally Adjusted Annualized Rate ("SAAR") of 15.4 million new car sales, down about four percent from August 2013 and up about four percent over September 2012.
Chemical Activity Barometer for September Suggests Economic Activity Increasing
This is a new indicator that I'm following that appears to be a leading indicator for the economy.
From the American Chemistry Council: Leading Economic Indicator at Highest Since June 2008; Hints at Potential Upside Surprises for U.S. Economy
 Click on graph for larger image.
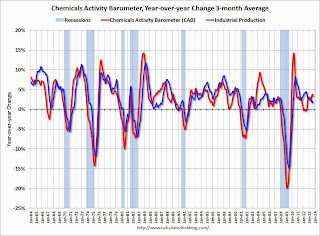
This graph shows the year-over-year change in the 3-month moving average for the Chemical Activity Barometer compared to Industrial Production. It does appear that CAB (red) generally leads Industrial Production (blue).
And this suggests that economic activity is increasing.
From the American Chemistry Council: Leading Economic Indicator at Highest Since June 2008; Hints at Potential Upside Surprises for U.S. Economy
The U.S. economy continues to improve, with forecasts now suggesting economic expansion into 2015, according to the American Chemistry Council’s (ACC) monthly Chemical Activity Barometer (CAB), released today. The Chemical Activity Barometer is a leading economic indicator, shown to lead U.S. business cycles by an average of eight months at cycle peaks, and four months at cycle troughs. The barometer increased 0.4 percent over August on a three-month moving average (3MMA) basis. The barometer is up 3.3 percent over a year ago, with the index itself at its highest point since June 2008. Prior CAB readings for April through August were all revised.
“This 0.4 percent jump is a real improvement in growth dynamics from the smaller, yet steady, increases we saw from March through August,” said Dr. Kevin Swift, chief economist at the American Chemistry Council. “The Chemical Activity Barometer is showing a strengthening of some fundamentals, with forecasts remaining positive. Indeed, there is potential for upside surprises in the U.S. economy,” he added.
emphasis added
 Click on graph for larger image.
This graph shows the year-over-year change in the 3-month moving average for the Chemical Activity Barometer compared to Industrial Production. It does appear that CAB (red) generally leads Industrial Production (blue).
And this suggests that economic activity is increasing.
Final September Consumer Sentiment at 77.5

Click on graph for larger image.
The final Reuters / University of Michigan consumer sentiment index for September was at 77.5, down from the August reading of 82.1, but up from the preliminary September reading of 76.8.
This was below the consensus forecast of 78.0. Sentiment has generally been improving following the recession - with plenty of ups and downs - and one big spike down when Congress threatened to "not pay the bills" in 2011. Unfortunately Congress is once again threatening to "not pay the bills" and that might impact sentiment (and consumer spending) in October.
Personal Income increased 0.4% in August, Spending increased 0.3%
The BEA released the Personal Income and Outlays report for August:
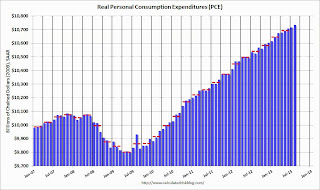
The following graph shows real Personal Consumption Expenditures (PCE) through August (2009 dollars). Note that the y-axis doesn't start at zero to better show the change.
 Click on graph for larger image.
The dashed red lines are the quarterly levels for real PCE.
Using the two-month method to estimate Q3 PCE growth (first two months of the quarter), PCE was increasing at a 1.5% annual rate in Q3 2013 (using mid-month method, PCE was increasing at 1.6% rate). This suggests sluggish PCE (and GDP) growth in Q3.
Personal income increased $57.2 billion, or 0.4 percent ... in August, according to the Bureau of Economic Analysis. Personal consumption expenditures (PCE) increased $34.5 billion, or 0.3 percent.On inflation, the PCE price index increased at a 1.7% annual rate in August, and core PCE prices increased at a 1.9% annual rate.
...
Real PCE -- PCE adjusted to remove price changes -- increased 0.2 percent in August, compared with an increase of 0.1 percent in July. ... The price index for PCE increased 0.1 percent in August, the same increase as in July. The PCE price index, excluding food and energy, increased 0.2 percent in August, compared with an increase of 0.1 percent in July.
The following graph shows real Personal Consumption Expenditures (PCE) through August (2009 dollars). Note that the y-axis doesn't start at zero to better show the change.
 Click on graph for larger image.
The dashed red lines are the quarterly levels for real PCE.
Using the two-month method to estimate Q3 PCE growth (first two months of the quarter), PCE was increasing at a 1.5% annual rate in Q3 2013 (using mid-month method, PCE was increasing at 1.6% rate). This suggests sluggish PCE (and GDP) growth in Q3.
Thursday, September 26, 2013
Hiring Freelancers to Expand Internationally
 |
| iStockphoto/Thinkstock |
Part of the data shows:
• 45% of businesses look to freelancers to expand into new marketsRead the entire article here. Related article: "Working with Others ..."
News: Related to hiring freelancers to take your business global, get ready for the biggest launch of the year ... my new exporting book coming soon, which will allow all small businesses and entrepreneurs to take their businesses to the next level of growth through exports. Watch for more information so you can sign up for tips related to exporting and pre-order with a price guarantee to secure your copy! I devote an entire chapter to "The Human Side of an Export Enterprise," which includes finding the best places to outsource work.
Friday: Personal Income and Outlays for August, Consumer Sentiment
From the LA Times: Downtown San Diego condo market's long drought may be ending
Along the same lines, I drove by "Central Park West" in Irvine today. That was the project that was built by Lennar and mothballed in 2007. There are several new buildings going up right now!
Friday:
• 8:30 AM ET, the Personal Income and Outlays for August. The consensus is for a 0.4% increase in personal income, and for a 0.3% increase in personal spending. And for the Core PCE price index to increase 0.1%.
• At 9:55 AM, Reuter's/University of Michigan's Consumer sentiment index (final for September). The consensus is for a reading of 78.0, up from the preliminary reading of 76.8, but down from the August reading of 82.1.
The Great Recession slammed the door on condominium construction in the 2.2-square-mile area. Projects were scrapped or converted to rentals. From 2001 through 2009, builders finished nearly 8,300 units, according to Civic San Diego, which oversees new construction planning downtown.Downtown San Diego was one of the areas that was crushed during the downturn.
They haven't finished one since.
[Canadian developer Nat] Bosa's ritzy project, which he plans to break ground on during the first half of next year, would change that.
Along the same lines, I drove by "Central Park West" in Irvine today. That was the project that was built by Lennar and mothballed in 2007. There are several new buildings going up right now!
Friday:
• 8:30 AM ET, the Personal Income and Outlays for August. The consensus is for a 0.4% increase in personal income, and for a 0.3% increase in personal spending. And for the Core PCE price index to increase 0.1%.
• At 9:55 AM, Reuter's/University of Michigan's Consumer sentiment index (final for September). The consensus is for a reading of 78.0, up from the preliminary reading of 76.8, but down from the August reading of 82.1.
Commentary: Congress will "Pay the Bills"
It seems more and more likely that there will be a partial government shutdown starting next Tuesday. This is expensive, dumb and inconvenient (for me, the delayed data releases will be frustrating). But the scary issue is the so-called "debt ceiling". Unfortunately "debt ceiling" sounds virtuous, but it isn't - it is actually a question of "paying the bills".
Sometimes we see articles like this in the NY Times: House G.O.P. Leaders List Conditions for Raising Debt Ceiling
As Republican Senator Mitch McConnell said in 2011, if the debt ceiling isn't raised the "Republican brand" would become toxic and synonymous with fiscal irresponsibility. Analysts are debating what will happen in the next election if Congress shuts down the government; I think the impact on the election will be minimal if the shutdown doesn't last very long. But if Congress stopped paying the bills - for the first time in 237 years (except some minor glitches) - people will remember. So it won't happen; Congress will pay the bills.
Now if we could just avoid a shutdown ...
Note: I said the thing in 2011, and again at the end of last year. The goods news is the eventual agreement will take the government through 2014 (so it will not be an election issue).
Sometimes we see articles like this in the NY Times: House G.O.P. Leaders List Conditions for Raising Debt Ceiling
[B]ehind closed doors in the Capitol, House Republican leaders laid out their demands for a debt-ceiling increase to the Republican rank and file.That is foolish. Just tell the "rank and file" the truth - it has to be a clean bill (as Reagan, Greenspan and many other Republicans have said before). As I pointed out in early January, a poker analogy is that the GOP is bluffing into the best possible hand - and everyone knows it. They will have to fold, and everything they say is just political posturing.
They include a one-year delay of the president’s health care law, fast-track authority to overhaul the tax code, construction of the Keystone XL oil pipeline, offshore oil and gas production, more permitting of energy exploration on federal lands, a rollback of regulations on coal ash, blocking new Environmental Protection Agency regulations on greenhouse gas production, eliminating a $23 billion fund to ensure the orderly dissolution of failed major banks, eliminating mandatory contributions to the new Consumer Financial Protection Bureau, limits on medical malpractice lawsuits and an increase in means testing for Medicare, among other provisions.
As Republican Senator Mitch McConnell said in 2011, if the debt ceiling isn't raised the "Republican brand" would become toxic and synonymous with fiscal irresponsibility. Analysts are debating what will happen in the next election if Congress shuts down the government; I think the impact on the election will be minimal if the shutdown doesn't last very long. But if Congress stopped paying the bills - for the first time in 237 years (except some minor glitches) - people will remember. So it won't happen; Congress will pay the bills.
Now if we could just avoid a shutdown ...
Note: I said the thing in 2011, and again at the end of last year. The goods news is the eventual agreement will take the government through 2014 (so it will not be an election issue).
Kansas City Fed: Manufacturing Survey "Moderated Somewhat"
From the Kansas City Fed: Tenth District Manufacturing Survey Moderated Somewhat
According to Chad Wilkerson, vice president and economist at the Federal Reserve Bank of Kansas City, the survey revealed that growth in Tenth District manufacturing activity moderated somewhat but remained positive, and producers’ expectations for future activity increased markedly.On Tuesday, the Richmond Fed reported:
“We saw slightly slower growth this month, but firms were much more optimistic about industry activity in early 2014” said Wilkerson. “Worker shortages remained a problem at many firms.”
...
The month-over-month composite index was 2 in September, down from 8 in August and 6 in July ... The employment index eased after rising last month
emphasis added
The composite index of manufacturing activity was flat in September, at a reading of 0 following last month's 14, as the component indexes cooled this month. ... The index for the number of employees fell twelve points from last month to settle at −6.In aggregate the regional surveys have suggested moderate growth in September. The last of the regional Fed manufacturing surveys for September will be released on Monday (Dallas Fed).
The overall outlook of producers for the next six months was for stronger business conditions. The gauge for expected shipments added three points to end at 39, and the index for the volume of new orders rose two points to 35 this month.
Employment: Preliminary annual benchmark revision shows upward adjustment of 345,000 jobs
This morning the BLS released the preliminary annual benchmark revision showing an additional 345,000 payroll jobs as of March 2013. The final revision will be published next February when the January 2014 employment report is released in February 2014. Usually the preliminary estimate is pretty close to the final benchmark estimate.
The annual revision is benchmarked to state tax records. From the BLS:
This preliminary estimate showed an additional 333,000 private sector jobs, and 12,000 government jobs (as of March 2013). Note: The revision would have been negative except for the reclassification of certain jobs (that weren't previously included in the payroll report).
The annual revision is benchmarked to state tax records. From the BLS:
In accordance with usual practice, the Bureau of Labor Statistics (BLS) is announcing the preliminary estimate of the upcoming annual benchmark revision to the establishment survey employment series. The final benchmark revision will be issued in February 2014, with the publication of the January 2014 Employment Situation news release.Using the preliminary benchmark estimate, this means that payroll employment in March 2013 was 345,000 higher than originally estimated. In February 2014, the payroll numbers will be revised up to reflect this estimate. The number is then "wedged back" to the previous revision (March 2012).
Each year, employment estimates from the Current Employment Statistics (CES) survey are benchmarked to comprehensive counts of employment for the month of March. These counts are derived from State Unemployment Insurance (UI) tax records that nearly all employers are required to file. For National CES employment series, the annual benchmark revisions over the last 10 years have averaged plus or minus three-tenths of one percent of Total nonfarm employment. The preliminary estimate of the benchmark revision indicates an upward adjustment to March 2013 Total nonfarm employment of 345,000 (0.3 percent). This revision is impacted by a large non-economic code change in the Quarterly Census of Employment and Wages (QCEW) that moves approximately 469,000 in employment from Private households, which is out-of-scope for CES, to the Education and health care services industry, which is in scope. After accounting for this movement, the estimate of the revision to the over-the-year change in CES from March 2012 to March 2013 is a downward revision of 124,000. ...
This preliminary estimate showed an additional 333,000 private sector jobs, and 12,000 government jobs (as of March 2013). Note: The revision would have been negative except for the reclassification of certain jobs (that weren't previously included in the payroll report).
Pending Home Sales Index declines 1.6% in August
From the NAR: Pending Home Sales Decline in August
The Pending Home Sales Index, a forward-looking indicator based on contract signings, eased 1.6 percent to 107.7 in August from a downwardly revised 109.4 in July, but remains 5.8 percent above August 2012 when it was 101.8; the data reflect contracts but not closings. Pending sales have been above year-ago levels for the past 28 months.Contract signings usually lead sales by about 45 to 60 days, so this would usually be for closed sales in September and October.
...
The PHSI in the Northeast rose 4.0 percent to 84.8 in August, and is 5.1 percent above a year ago. In the Midwest the index declined 1.4 percent to 111.6 in August, but is 13.8 percent higher than August 2012. Pending home sales in the South fell 3.5 percent to an index of 116.9 in August, but are 3.7 percent above a year ago. The index in the West declined 1.6 percent in August to 106.9, but is 1.7 percent higher than August 2012.
Weekly Initial Unemployment Claims decline to 305,000, Four Week Average lowest since June 2007
The DOL reports:
The following graph shows the 4-week moving average of weekly claims since January 2000.
 Click on graph for larger image.
The dashed line on the graph is the current 4-week average. The four-week average of weekly unemployment claims decreased to 308,000.
The 4-week average is at the lowest level since June 2007 (before the recession started). Claims were below the 330,000 consensus forecast.
 Here is a long term graph of the 4-week average of weekly unemployment claims back to 1971.
From MarketWatch:
In the week ending September 21, the advance figure for seasonally adjusted initial claims was 305,000, a decrease of 5,000 from the previous week's revised figure of 310,000. The 4-week moving average was 308,000, a decrease of 7,000 from the previous week's revised average of 315,000.The previous week was revised up from 309,000.
The following graph shows the 4-week moving average of weekly claims since January 2000.
 Click on graph for larger image.
The dashed line on the graph is the current 4-week average. The four-week average of weekly unemployment claims decreased to 308,000.
The 4-week average is at the lowest level since June 2007 (before the recession started). Claims were below the 330,000 consensus forecast.
 Here is a long term graph of the 4-week average of weekly unemployment claims back to 1971.
From MarketWatch:
A government official said Labor has been told by California that the state eliminated a backlog of claims that built up after computer-related processing delays.
Places to Avoid When Exporting?
 |
| iStockphoto/ThinkStock |
Find out what was suggested during the discussions here: Small Business Exporting
One of the excellent points made was:
"Another way you can gain insight about where there may be success – or where you should maybe avoid exporting – is by checking out industry association meetings ..."Note: Coming soon ... my new Exporting book, which will equip you with the knowledge you need to market, sell, and fulfill orders internationally, taking full advantage of the Internet and the opportunities it creates. Watch for news shortly!
Wednesday, September 25, 2013
LPS: Mortgage Delinquency Rate declined further in August, In-Foreclosure Rate lowest in 4 1/2 Years
According to the First Look report for August to be released today by Lender Processing Services (LPS), the percent of loans delinquent decreased in August compared to July, and declined about 10% year-over-year. Also the percent of loans in the foreclosure process declined further in August and were down 34% over the last year.
LPS reported the U.S. mortgage delinquency rate (loans 30 or more days past due, but not in foreclosure) decreased to 6.20% from 6.41% in July. The normal rate for delinquencies is around 4.5% to 5%.
The percent of loans in the foreclosure process declined to 2.66% in August from 2.82% in July. The is the lowest level in 4 1/2 years.
The number of delinquent properties, but not in foreclosure, is down 306,000 properties year-over-year, and the number of properties in the foreclosure process is down 679,000 properties year-over-year.
LPS will release the complete mortgage monitor for August in early October.
| LPS: Percent Loans Delinquent and in Foreclosure Process | |||
|---|---|---|---|
| August 2013 | July 2013 | August 2012 | |
| Delinquent | 6.20% | 6.41% | 6.87% |
| In Foreclosure | 2.66% | 2.82% | 4.04% |
| Number of properties: | |||
| Number of properties that are 30 or more, and less than 90 days past due, but not in foreclosure: | 1,836,000 | 1,846,000 | 1,910,000 |
| Number of properties that are 90 or more days delinquent, but not in foreclosure: | 1,288,000 | 1,347,000 | 1,520,000 |
| Number of properties in foreclosure pre-sale inventory: | 1,341,000 | 1,406,000 | 2,020,000 |
| Total Properties | 4,465,000 | 4,599,000 | 5,450,000 |
Thursday: Unemployment Claims, Q2 GDP Revision, Pending Home Sales, Prelim Annual Employment Benchmark
The preliminary annual employment benchmark revision will be released Thursday. On Sunday I wrote a post with a summary of previous revisions, and some details on how the revisions is estimated, See: Preliminary annual Employment benchmark revision. Some analysts expect a negative revisions, others a positive revision. My guess is the revision will be small this year.
Thursday:
• Early: LPS First Look at Mortgage Delinquencies in August.
• 8:30 AM ET, the initial weekly unemployment claims report will be released. The consensus is for claims to increase to 330 thousand from 309 thousand last week.
• Also at 8:30 AM, the Q2 GDP (third estimate) from the BEA. This is the second estimate of Q2 GDP from the BEA. The consensus is that real GDP increased 2.6% annualized in Q2, revised up from the second estimate of 2.5% in Q2.
• At 10:00 AM, the Pending Home Sales Index for August. The consensus is for a 1.0% decrease in the index. Economist Tom Lawler is estimating the NAR will report a decline of "about 5%" in this index.
• Also at 10:00 AM, the 2013 Current Employment Statistics (CES) Preliminary Benchmark Revision. From the BLS: "[T]he Current Employment Statistics (CES) survey estimates are benchmarked to comprehensive counts of employment from the Quarterly Census of Employment and Wages (QCEW) for the month of March. ... The final benchmark revision will be issued with the publication of the January 2014 Employment Situation news release in February."
• At 10:00 AM, the Kansas City Fed Survey of Manufacturing Activity for August. The consensus is for a reading of 9 for this survey, up from 8 in August (Above zero is expansion).
Comments on New Home Sales
Earlier: New Home Sales increased to 421,000 Annual Rate in August
Looking at the first eight months of 2013, there has been a significant increase in new home sales this year. The Census Bureau reported that there were 304 new homes sold during the first eight months of 2013, up 19.7% from the 254 thousand sold during the same period in 2012.
The year-over-year increases have slowed - August only saw a year-over-year increase of 12.6%, but I still expect new home sales to be up 15% to 20% for the year. That follows an annual increase of 21% in 2012.
And even though there has been a large increase in the sales rate, sales are close to the lows for previous recessions. This suggests significant upside over the next few years. Based on estimates of household formation and demographics, I expect sales to increase to 750 to 800 thousand over the next several years - substantially higher than the current 421 thousand sales rate.
The housing recovery has slowed, but it is ongoing - and I expect the recovery to continue for some time.
Note: As I mentioned last month, any impact from rising mortgage rates would show up in the New Home sales report before the existing home sales report. New home sales are counted when contracts are signed, and existing home sales when the transactions are closed - so the timing is different. For existing home sales, I think there was a push to close before the mortgage interest rate lock expired - so closed existing home sales in July and August were strong - and I expect a decline in existing home sales soon.
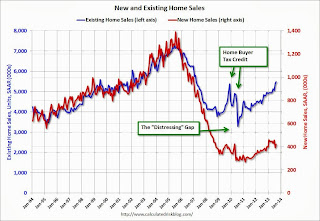
And here is another update to the "distressing gap" graph that I first started posting over four years ago to show the emerging gap caused by distressed sales. Now I'm looking for the gap to close over the next few years.
 Click on graph for larger image.
The "distressing gap" graph shows existing home sales (left axis) and new home sales (right axis) through August 2013. This graph starts in 1994, but the relationship has been fairly steady back to the '60s.
Following the housing bubble and bust, the "distressing gap" appeared mostly because of distressed sales. The flood of distressed sales kept existing home sales elevated, and depressed new home sales since builders weren't able to compete with the low prices of all the foreclosed properties.
I expect existing home sales to decline some (distressed sales will slowly decline and be partially offset by more conventional sales). And I expect this gap to continue to close - mostly from an increase in new home sales.
Note: Existing home sales are counted when transactions are closed, and new home sales are counted when contracts are signed. So the timing of sales is different.
Looking at the first eight months of 2013, there has been a significant increase in new home sales this year. The Census Bureau reported that there were 304 new homes sold during the first eight months of 2013, up 19.7% from the 254 thousand sold during the same period in 2012.
The year-over-year increases have slowed - August only saw a year-over-year increase of 12.6%, but I still expect new home sales to be up 15% to 20% for the year. That follows an annual increase of 21% in 2012.
And even though there has been a large increase in the sales rate, sales are close to the lows for previous recessions. This suggests significant upside over the next few years. Based on estimates of household formation and demographics, I expect sales to increase to 750 to 800 thousand over the next several years - substantially higher than the current 421 thousand sales rate.
The housing recovery has slowed, but it is ongoing - and I expect the recovery to continue for some time.
Note: As I mentioned last month, any impact from rising mortgage rates would show up in the New Home sales report before the existing home sales report. New home sales are counted when contracts are signed, and existing home sales when the transactions are closed - so the timing is different. For existing home sales, I think there was a push to close before the mortgage interest rate lock expired - so closed existing home sales in July and August were strong - and I expect a decline in existing home sales soon.
And here is another update to the "distressing gap" graph that I first started posting over four years ago to show the emerging gap caused by distressed sales. Now I'm looking for the gap to close over the next few years.
 Click on graph for larger image.
The "distressing gap" graph shows existing home sales (left axis) and new home sales (right axis) through August 2013. This graph starts in 1994, but the relationship has been fairly steady back to the '60s.
Following the housing bubble and bust, the "distressing gap" appeared mostly because of distressed sales. The flood of distressed sales kept existing home sales elevated, and depressed new home sales since builders weren't able to compete with the low prices of all the foreclosed properties.
I expect existing home sales to decline some (distressed sales will slowly decline and be partially offset by more conventional sales). And I expect this gap to continue to close - mostly from an increase in new home sales.
Note: Existing home sales are counted when transactions are closed, and new home sales are counted when contracts are signed. So the timing of sales is different.
Fed's Q2 Flow of Funds: Household Mortgage Debt down $1.3 Trillion from Peak, Record Household Net Worth
The Federal Reserve released the Q2 2013 Flow of Funds report today: Flow of Funds.
According to the Fed, household net worth increased in Q2 compared to Q1, and is at a new record. Net worth peaked at $69.0 trillion in Q3 2007, and then net worth fell to $55.6 trillion in Q1 2009 (a loss of $13.4 trillion). Household net worth was at $74.8 trillion in Q2 2013 (up $19.2 trillion from the trough in Q1 2009).
The Fed estimated that the value of household real estate increased to $18.6 trillion in Q2 2013. The value of household real estate is still $4.0 trillion below the peak in early 2006.
 Click on graph for larger image.
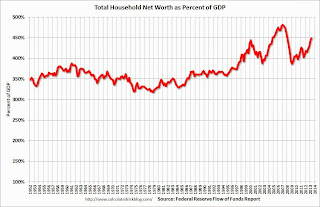
This is the Households and Nonprofit net worth as a percent of GDP. Although household net worth is at a record high, as a percent of GDP it is still below the peaks in 2000 (stock bubble) and 2006 (housing bubble).
This includes real estate and financial assets (stocks, bonds, pension reserves, deposits, etc) net of liabilities (mostly mortgages). Note that this does NOT include public debt obligations.
This ratio was increasing gradually since the mid-70s, and then we saw the stock market and housing bubbles. The ratio has been trending up and increased again in Q2 with both stock and real estate prices increasing.
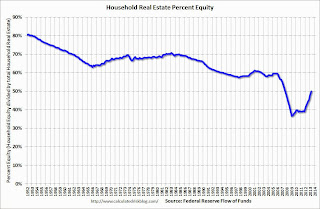 This graph shows homeowner percent equity since 1952.
Household percent equity (as measured by the Fed) collapsed when house prices fell sharply in 2007 and 2008.
In Q2 2013, household percent equity (of household real estate) was at 49.8% - up from Q1, and the highest since Q3 2007. This was because of both an increase in house prices in Q2 (the Fed uses CoreLogic) and a reduction in mortgage debt.
Note: about 30.3% of owner occupied households had no mortgage debt as of April 2010. So the approximately 52+ million households with mortgages have far less than 49.8% equity - and millions have negative equity.
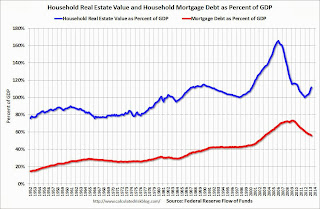 The third graph shows household real estate assets and mortgage debt as a percent of GDP.
Mortgage debt declined by $41.8 billion in Q2. Mortgage debt has now declined by $1.32 trillion from the peak. Studies suggest most of the decline in debt has been because of foreclosures (or short sales), but some of the decline is from homeowners paying down debt (sometimes so they can refinance at better rates).
The value of real estate, as a percent of GDP, was up in Q2 (as house prices increased), but still close to the average of the last 30 years (excluding bubble). However household mortgage debt, as a percent of GDP, is still historically high, suggesting still more deleveraging ahead for certain households.
According to the Fed, household net worth increased in Q2 compared to Q1, and is at a new record. Net worth peaked at $69.0 trillion in Q3 2007, and then net worth fell to $55.6 trillion in Q1 2009 (a loss of $13.4 trillion). Household net worth was at $74.8 trillion in Q2 2013 (up $19.2 trillion from the trough in Q1 2009).
The Fed estimated that the value of household real estate increased to $18.6 trillion in Q2 2013. The value of household real estate is still $4.0 trillion below the peak in early 2006.
 Click on graph for larger image.
This is the Households and Nonprofit net worth as a percent of GDP. Although household net worth is at a record high, as a percent of GDP it is still below the peaks in 2000 (stock bubble) and 2006 (housing bubble).
This includes real estate and financial assets (stocks, bonds, pension reserves, deposits, etc) net of liabilities (mostly mortgages). Note that this does NOT include public debt obligations.
This ratio was increasing gradually since the mid-70s, and then we saw the stock market and housing bubbles. The ratio has been trending up and increased again in Q2 with both stock and real estate prices increasing.
 This graph shows homeowner percent equity since 1952.
 Household percent equity (as measured by the Fed) collapsed when house prices fell sharply in 2007 and 2008.
In Q2 2013, household percent equity (of household real estate) was at 49.8% - up from Q1, and the highest since Q3 2007. This was because of both an increase in house prices in Q2 (the Fed uses CoreLogic) and a reduction in mortgage debt.
Note: about 30.3% of owner occupied households had no mortgage debt as of April 2010. So the approximately 52+ million households with mortgages have far less than 49.8% equity - and millions have negative equity.
 The third graph shows household real estate assets and mortgage debt as a percent of GDP.
 Mortgage debt declined by $41.8 billion in Q2. Mortgage debt has now declined by $1.32 trillion from the peak. Studies suggest most of the decline in debt has been because of foreclosures (or short sales), but some of the decline is from homeowners paying down debt (sometimes so they can refinance at better rates).
The value of real estate, as a percent of GDP, was up in Q2 (as house prices increased), but still close to the average of the last 30 years (excluding bubble). However household mortgage debt, as a percent of GDP, is still historically high, suggesting still more deleveraging ahead for certain households.
New Home Sales increased to 421,000 Annual Rate in August
The Census Bureau reports New Home Sales in August were at a seasonally adjusted annual rate (SAAR) of 421 thousand. This was up from 390 thousand SAAR in July (July sales were revised down from 394 thousand).
May sales were revised down from 439 thousand to 429 thousand, and June sales were revised down from 455 thousand to 454 thousand.
The first graph shows New Home Sales vs. recessions since 1963. The dashed line is the current sales rate.
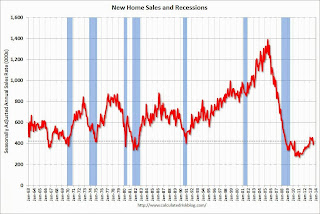 Click on graph for larger image in graph gallery.
The second graph shows New Home Months of Supply.
The months of supply decreased in August to 5.0 months from 5.2 months in July.
The all time record was 12.1 months of supply in January 2009.
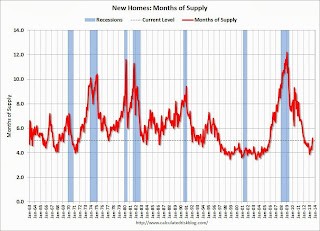 This is now in the normal range (less than 6 months supply is normal).
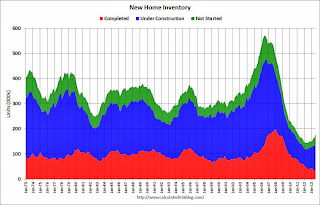 This graph shows the three categories of inventory starting in 1973.
The inventory of completed homes for sale is near the record low. The combined total of completed and under construction is increasing, but still very low.
The last graph shows sales NSA (monthly sales, not seasonally adjusted annual rate).
In August 2013 (red column), 35 thousand new homes were sold (NSA). Last year 31 thousand homes were sold in August. The high for August was 110 thousand in 2005, and the low for August was 23 thousand in 2010.
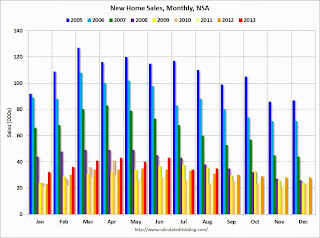
This was slightly below expectations of 425,000 sales in August, and a weak report including the minor downward revisions to prior months. I'll have more later today.
May sales were revised down from 439 thousand to 429 thousand, and June sales were revised down from 455 thousand to 454 thousand.
The first graph shows New Home Sales vs. recessions since 1963. The dashed line is the current sales rate.
"Sales of new single-family houses in August 2013 were at a seasonally adjusted annual rate of 421,000, according to estimates released jointly today by the U.S. Census Bureau and the Department of Housing and Urban Development. This is 7.9 percent above the revised July rate of 390,000 and is 12.6 percent above the August 2012 estimate of 374,000."
 Click on graph for larger image in graph gallery.
The second graph shows New Home Months of Supply.
The months of supply decreased in August to 5.0 months from 5.2 months in July.
The all time record was 12.1 months of supply in January 2009.
 This is now in the normal range (less than 6 months supply is normal).
"The seasonally adjusted estimate of new houses for sale at the end of August was 175,000. This represents a supply of 5.0 months at the current sales rate."On inventory, according to the Census Bureau:
"A house is considered for sale when a permit to build has been issued in permit-issuing places or work has begun on the footings or foundation in nonpermit areas and a sales contract has not been signed nor a deposit accepted."Starting in 1973 the Census Bureau broke this down into three categories: Not Started, Under Construction, and Completed.
 This graph shows the three categories of inventory starting in 1973.
The inventory of completed homes for sale is near the record low. The combined total of completed and under construction is increasing, but still very low.
The last graph shows sales NSA (monthly sales, not seasonally adjusted annual rate).
In August 2013 (red column), 35 thousand new homes were sold (NSA). Last year 31 thousand homes were sold in August. The high for August was 110 thousand in 2005, and the low for August was 23 thousand in 2010.

This was slightly below expectations of 425,000 sales in August, and a weak report including the minor downward revisions to prior months. I'll have more later today.
MBA: Mortgage Applications Increase in Latest Weekly Survey, HARP Refinance Share Increases
From the MBA: Mortgage Applications Increase in Latest MBA Weekly Survey
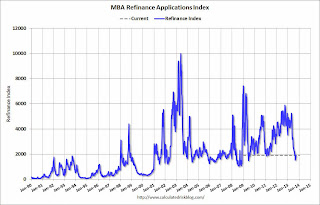 Click on graph for larger image.
The first graph shows the refinance index.
The refinance index increased partially because of more HARP refinance activity. I expect to see even more HARP activity soon. From Mortgage News Daily: HARP is a "No Brainer" -FHFA
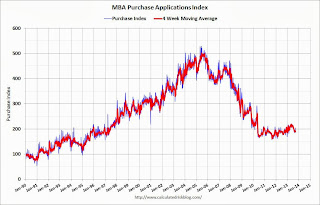 The second graph shows the MBA mortgage purchase index.
The 4-week average of the purchase index was generally been trending up over the last year (but down over the last few months), and the 4-week average of the purchase index is at the highest level since July and up over 3% from a year ago.
Mortgage applications increased 5.5 percent from one week earlier, according to data from the Mortgage Bankers Association’s (MBA) Weekly Mortgage Applications Survey for the week ending September 20, 2013....
The Refinance Index increased 5 percent from the previous week. The seasonally adjusted Purchase Index increased 7 percent from one week earlier. ... The Purchase Index was at its highest level since July 2013.
...
The HARP share of refinance applications increased to 41 percent from 40 percent the week before, and is the highest since MBA started tracking this measure in early 2012.
...
The average contract interest rate for 30-year fixed-rate mortgages with conforming loan balances ($417,000 or less) decreased to 4.62 percent from 4.75 percent, with points increasing to 0.41 from 0.39 (including the origination fee) for 80 percent loan-to-value ratio (LTV) loans.
emphasis added
 Click on graph for larger image.
The first graph shows the refinance index.
The refinance index increased partially because of more HARP refinance activity. I expect to see even more HARP activity soon. From Mortgage News Daily: HARP is a "No Brainer" -FHFA
Feeling that they may have reached only about half of the families who could benefit from the program, the Federal Housing Finance Agency (FHFA) launched a campaign today to inform homeowners about the Home Affordable Refinance Program (HARP). ...
Acting FHFA Director Edward J. DeMarco said that 2.8 million homeowners have refinanced through HARP but with mortgage rates still historically low and HARP eligibility requirements expanded, other qualified homeowners could reduce their monthly mortgage payments or build their equity faster with a shorter term mortgage through the program.
DeMarco told Bloomberg News in an interview this weekend that FHFA used focus groups to find out why borrowers with high rates hadn't yet tried to refinance through HARP. They found many didn't realize they were eligible. They thought they had to be delinquent on their mortgages before the government would help them. DeMarco said he hoped the educational outreach would bring in an additional 2 million HARP borrowers.
 The second graph shows the MBA mortgage purchase index.
 The 4-week average of the purchase index was generally been trending up over the last year (but down over the last few months), and the 4-week average of the purchase index is at the highest level since July and up over 3% from a year ago.
Opting for Halal on a Global Basis
 |
| iStockphoto/Thinkstock |
This week an estimated 20,000 Haloodies will congregate in east London at the Halal Food Festival, the world's first gastronomic celebration of halal produce. All of the UK's major supermarket chains are sending scouts to help them find ways to exploit the trend. Attendees can browse food stalls offering anything from hot dogs and sushi to French and Moroccan dishes without worrying how the meat was killed or even transported.Think it's a trend? Find out more here.
Tuesday, September 24, 2013
Zillow: Case-Shiller House Price Index expected to show 12.4% year-over-year increase in August
Wednesday:
• At 7:00 AM ET, the Mortgage Bankers Association (MBA) will release the results for the mortgage purchase applications index.
• At 8:30 AM, the Durable Goods Orders report for August will be released by the Census Bureau. The consensus is for a 0.5% decline in durable goods orders.
• At 10:00 AM, New Home Sales for August from the Census Bureau. The consensus is for an increase in sales to 425 thousand Seasonally Adjusted Annual Rate (SAAR) in August from 394 thousand in July. Based on the various reports, sales were probably weak again in August.
• At 12:00 PM, the Federal Reserve will release the Q2 Flow of Funds Accounts of the United States.
The Case-Shiller house price indexes for July were released yesterday. Zillow has started forecasting Case-Shiller a month early - and I like to check the Zillow forecasts since they have been pretty close.
From Zillow: August Case Shiller Indices Expected to Show Further Monthly Slowdowns
The Case-Shiller data for July came out this morning and, based on this information and the August 2013 Zillow Home Value Index (released yesterday), we predict that next month’s Case-Shiller data (August 2013) will show that both the non-seasonally adjusted (NSA) 20-City Composite Home Price Index and the NSA 10-City Composite Home Price Index increased 12.4 percent on a year-over-year basis. The seasonally adjusted (SA) month-over-month change from July to August will be 0.6 percent for both the 20-City Composite and the 10-City Composite Home Price Indices (SA). All forecasts are shown in the table below. Officially, the Case-Shiller Composite Home Price Indices for August will not be released until Tuesday, October 29.The following table shows the Zillow forecast for the August Case-Shiller index.
...
Both the Case-Shiller indices and the Zillow Home Value index are showing the first signs of moderation in home value appreciation. We are seeing slowing in month-over-month appreciation, although the Case-Shiller indices will continue to show an inflated picture of home prices. The Case-Shiller indices are biased toward the large, coastal metros currently seeing enormous home value gains, and they include foreclosure resales. The inclusion of foreclosure resales disproportionately boosts the index when these properties sell again for much higher prices — not just because of market improvements, but also because the sales are no longer distressed.
...
To forecast the Case-Shiller indices, we use the July Case-Shiller index level, as well as the August Zillow Home Value Index (ZHVI), which is available more than a month in advance of the Case-Shiller index, paired with July foreclosure resale numbers, which Zillow also publishes more than a month prior to the release of the Case-Shiller index. Together, these data points enable us to reliably forecast the Case-Shiller 10-City and 20-City Composite indices.
| Zillow August Forecast for Case-Shiller Index | |||||
|---|---|---|---|---|---|
| Case Shiller Composite 10 | Case Shiller Composite 20 | ||||
| NSA | SA | NSA | SA | ||
| Case Shiller (year ago) | August 2012 | 158.51 | 154.97 | 145.81 | 142.44 |
| Case-Shiller (last month) | July 2013 | 176.52 | 173.19 | 162.49 | 159.18 |
| Zillow Forecast | YoY | 12.4% | 12.4% | 12.4% | 12.4% |
| MoM | 0.9% | 0.6% | 0.8% | 0.6% | |
| Zillow Forecasts1 | 178.1 | 174.2 | 163.8 | 160.1 | |
| Current Post Bubble Low | 146.46 | 149.63 | 134.07 | 136.87 | |
| Date of Post Bubble Low | Mar-12 | Jan-12 | Mar-12 | Jan-12 | |
| Above Post Bubble Low | 21.6% | 16.4% | 22.2% | 17.0% | |
| 1Estimate based on Year-over-year and Month-over-month Zillow forecasts | |||||
Lawler on Home Builder Results: Rising Rates, Aggressive Price Increases Dampened Sales
From housing economist Tom Lawler:
Lennar Corporation reported that net home orders in the quarter ended August 31, 2013 totaled 4,785, up 14.0% from the comparable quarter of 2012, at an average net order price of about $316,750, up 16% from a year ago. Home deliveries totaled 4,990 last quarter, up 36.5% from the comparable quarter of 2012, at an average sales price of $291,000, up 12.8% from a year ago. Sales discounts as a % of purchase price averaged 6.0% last quarter, down from 9.2% in the comparable quarter of 2012. The company’s sales cancellation rate, expressed as a % of gross orders, was 18% last quarter, up from 18% from a year ago. The company’s order backlog at the end of August totaled 5,958, up 32.0% from last August.
KB Homes reported that net home orders totaled 1,736 in the quarter ended August 31, 2013, down 8.6% from the comparable quarter of 2012, at an average net order price of about $304,650, up 16% from a year ago. Home deliveries totaled 1,825 last quarter, up 6.1% from the comparable quarter of 2012, at an average sales price of $299,100, up 22.0% from a year ago. The company’s sales cancellation rate, expressed as a % of gross orders, was 33% last quarter, up 29% from a year ago. The company’s order backlog at the end of August totaled 3,039, down 3.3% from last August.
Here are some quarterly net orders numbers for three large builders (note: Hovnanian’s fiscal quarters end in April and July, but it shows monthly net orders numbers through August in its last presentation).
| Net Home Orders, 3 Months Ending: | ||||||
|---|---|---|---|---|---|---|
| 8/31/2013 | 8/31/2012 | % Change | 5/31/2013 | 5/31/2012 | % Change | |
| Lennar Corp. | 4,785 | 4,198 | 14.0% | 5,705 | 4,481 | 27.3% |
| KB Home | 1,736 | 1,900 | -8.6% | 2,162 | 2,049 | 5.5% |
| Hovnanian Ent. | 1,487 | 1,519 | -2.1% | 1,862 | 1,753 | 6.2% |
| Total | 8,008 | 7,617 | 5.1% | 9,729 | 8,283 | 17.5% |
Subscribe to:
Posts (Atom)