Saturday, August 31, 2013

Unofficial Problem Bank list declines to 707 Institutions

This is an unofficial list of Problem Banks compiled only from public sources.

Here is the unofficial problem bank list for August 30, 2013.

Changes and comments from surferdude808:
This week, the FDIC finally released industry results for the second quarter and its enforcement actions through July. For the week, there were 11 removals and four additions. The changes leave the Unofficial Problem Bank List holding 707 institutions with assets of $250.6 billion. A year ago, the list held 891 institutions with assets of $331.5 billion. For the month, the list declined by a net 22 institutions and dropped $102 billion of assets. Monthly activity included six additions, one unassisted merger, four failures, and 23 action terminations, which was the most action terminations in a month since 25 cures in April 2012. With second quarter industry results, the FDIC said there are 559 institutions with assets of $192 billion on the Official Problem Bank List. The difference between the two lists dropped by one institution to 148. We had anticipated for the difference to narrow to about 135.

The FDIC terminated actions against Inland Bank and Trust, Oak Brook, IL ($1.0 billion); Highland Bank, Saint Michael, MN ($429 million); Community Bank of Oak Park River Forest, Oak Park, IL ($272 million); First Southwest Bank, Alamosa, CO ($237 million); Signature Bank, Bad Axe, MI ($224 million); The Union Bank, Marksville, LA ($219 million); Community Trust & Banking Company, Ooltewah, TN ($131 million); Metropolitan Bank, Oakland, CA ($128 million); Cambridge State Bank, Cambridge, MN ($69 million); Elysian Bank, Elysian, MN ($42 million); and Vermont State Bank, Vermont, IL ($17 million).

Additions this week include United International Bank, Flushing, NY ($177 million); State Bank of Taunton, Taunton, MN ($71 million); Allendale County Bank, Fairfax, SC ($59 million); and Citizens Bank of Chatsworth, Chatsworth, IL ($48 million).

Not much new to report on Capitol Bancorp Ltd. other than its outside counsel squawking at the FDIC labeling its actions "imprudent and counterproductive." Within an article published by SNL Securities - Capitol Bancorp legal rep slams FDIC's 'imprudent and counterproductive actions', Andrew Sandler, chairman of BuckleySandler LLP, said "The FDIC is operating with extraordinary powers and seems all too willing to ignore judges, experts and others in effecting closures."  Five banks controlled by Capital Bancorp have failed, which have cost the bank insurance fund an estimated 48 million. The FDIC could utilize the cross-guaranty provisions of FIRREA to assess the cost of the failures against the remaining banks controlled by Capitol Bancorp, which could lead to their failure. 
CR Note: The first unofficial problem bank list was published in August 2009 with 389 institutions. The list peaked at 1,002 institutions on June 10, 2011, and is now down to 707.

Schedule for Week of September 1st

The key report this week is the August employment report on Friday. 

Other key reports include the ISM manufacturing report on Tuesday, the trade deficit on Wednesday, and August auto sales also on Wednesday.

----- Monday, September 2nd -----

All US markets will be closed in observance of the Labor Day holiday.

----- Tuesday, September 3rd -----

Early: The LPS July Mortgage Monitor report. This is a monthly report of mortgage delinquencies and other mortgage data.

9:00 AM: The Markit US PMI Manufacturing Index for August. The consensus is for the index to increase to 53.9 from 53.7 in July.

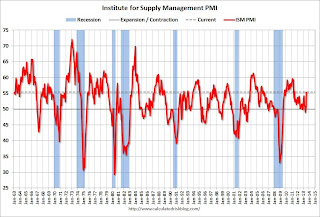
ISM PMI10:00 AM ET: ISM Manufacturing Index for August. The consensus is for an derease to 53.8 from 55.4 in July.  Based on the regional surveys, a decrease in August seems likely.

Here is a long term graph of the ISM manufacturing index.

The ISM manufacturing index indicated expansion in 55.4% in July. The employment index was at 54.4%, and the new orders index was at 58.3%.

10:00 AM: Construction Spending for July. The consensus is for a 0.3% increase in construction spending.

----- Wednesday, September 4th -----

7:00 AM: The Mortgage Bankers Association (MBA) will release the results for the mortgage purchase applications index.

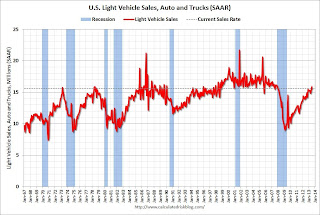
Vehicle SalesAll day: Light vehicle sales for August. The consensus is for light vehicle sales to increase to 15.8 million SAAR in August (Seasonally Adjusted Annual Rate) from 15.7million SAAR in July.

This graph shows light vehicle sales since the BEA started keeping data in 1967. The dashed line is the July sales rate.

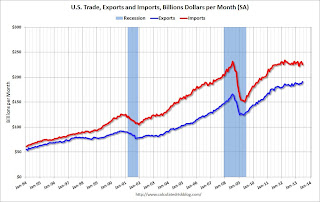
U.S. Trade Exports Imports 8:30 AM: Trade Balance report for July from the Census Bureau.

Imports decreased in June, and exports increased.

The consensus is for the U.S. trade deficit to increase to $39.0 billion in July from $34.2 billion in June.

2:00 PM: Federal Reserve Beige Book, an informal review by the Federal Reserve Banks of current economic conditions in their Districts.

----- Thursday, September 5th -----

8:15 AM: The ADP Employment Report for August. This report is for private payrolls only (no government). The consensus is for 177,000 payroll jobs added in August, down from 200,000 in July.  

8:30 AM: The initial weekly unemployment claims report will be released. The consensus is for claims to decrease to 330 thousand from 331 thousand last week.

10:00 AM: ISM non-Manufacturing Index for August. The consensus is for a reading of 55.0, down from 56.0 in July. Note: Above 50 indicates expansion, below 50 contraction.

10:00 AM: Manufacturers' Shipments, Inventories and Orders (Factory Orders) for July. The consensus is for a 3.4% decrease in orders.

10:00 AM: Trulia Price Rent Monitors for August. This is the index from Trulia that uses asking house prices adjusted both for the mix of homes listed for sale and for seasonal factors.

----- Friday, September 6th -----

8:30 AM: Employment Report for August. The consensus is for an increase of 175,000 non-farm payroll jobs in August; the economy added 162,000 non-farm payroll jobs in June.

The consensus is for the unemployment rate to be unchanged at 7.4 in August.

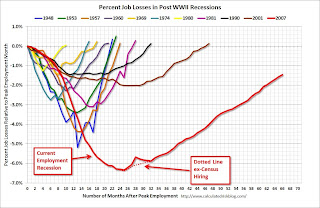
The following graph shows the percentage of payroll jobs lost during post WWII recessions through July.

Percent Job Losses During RecessionsThe economy has added 7.3 million private sector jobs since employment bottomed in February 2010 (6.7 million total jobs added including all the public sector layoffs).

There are still 1.5 million fewer private sector jobs now than when the recession started in 2007.

Go Rock a Boat

“Only the guy who isn't rowing has time to rock the boat." - Jean-Paul Sartre

Photo courtesy:  ©2013 Laurel Delaney.  All rights reserved.

Friday, August 30, 2013

Vehicle Sales: Another strong month in August

Note: The automakers will report August vehicle sales on Wednesday, Sept 4th. 

According the Bureau of Economic Analysis (BEA), light vehicle sales in July were at a 15.7 million rate, on a seasonally adjusted annual rate (SAAR) basis.  It looks like August sales will be in the same range.

Here are a few forecasts:

From Kelley Blue Book: Crossovers, Pickup Trucks Lift August Sales Nearly 14 Percent, According To Kelley Blue Book
In August, new light-vehicle sales, including fleet, are expected to hit 1,460,000 units, up 13.6 percent from August 2012 and up 11.0 percent from July 2013.

The seasonally adjusted annual rate (SAAR) for August 2013 is estimated to be 15.6 million, up from 14.5 million in August 2012 and down from 15.8 million in July 2013.
Press Release: J.D. Power and LMC Automotive Report: August New-Vehicle Sales Reach Highest Level in Seven Years
With consistency in the fleet environment, total light-vehicle sales in August 2013 are also expected to increase by 12 percent from August 2012 to 1,495,400. Fleet sales are expected to account for 15 percent of total sales, with volume of 225,000 units.

PIN and LMC data show total sales reaching a 16 million unit SAAR in August, which is the highest since November 2007, with actual unit sales the highest since May 2007.
From TrueCar: August 2013 New Car Sales Expected to Be Up 14.4 Percent According to TrueCar; August 2013 SAAR at 15.75M, Highest August SAAR since 2007
For August 2013, new light vehicle sales in the U.S. (including fleet) is expected to be 1,464,214 units, up 14.4 percent from August 2012 and up 11.8% percent from July 2013 (on an unadjusted basis).

The August 2013 forecast translates into a Seasonally Adjusted Annualized Rate ("SAAR") of 15.75 million new car sales
The analyst consensus is for sales of 15.8 million SAAR in August.

Fannie Mae: Mortgage Serious Delinquency rate declined in July, Lowest since December 2008

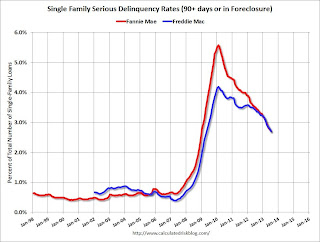
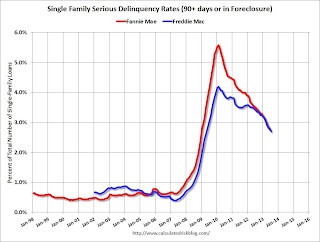
Fannie Mae reported today that the Single-Family Serious Delinquency rate declined in July to 2.70% from 2.77% in June. The serious delinquency rate is down from 3.50% in July 2012, and this is the lowest level since December 2008.

The Fannie Mae serious delinquency rate peaked in February 2010 at 5.59%.

Earlier Freddie Mac reported that the Single-Family serious delinquency rate declined in July to 2.70% from 2.79% in June. Freddie's rate is down from 3.42% in July 2012, and this is the lowest level since April 2009. Freddie's serious delinquency rate peaked in February 2010 at 4.20%..

Note: These are mortgage loans that are "three monthly payments or more past due or in foreclosure".

Fannie Freddie Seriously Delinquent RateClick on graph for larger image

The Fannie Mae serious delinquency rate has fallen 0.8 percentage points over the last year, and at that pace the serious delinquency rate will be under 1% in just under 2 years. Note: The "normal" serious delinquency rate is under 1%.

Maybe serious delinquencies will be back to normal in mid-2015.

Chemical Activity Barometer for August shows "Economy on the Upswing"

This is a new indicator that I'm following that appears to be a leading indicator for the economy.

From the American Chemistry Council: Leading Economic Indicator Shows U.S. Economy on the Upswing; Consumer-Driven Production Gains Strengthen
The pendulum of the U.S. economy remains on the upswing, according to the American Chemistry Council’s (ACC) monthly Chemical Activity Barometer (CAB), released today. The economic indicator, shown to lead U.S. business cycles by an average of eight months at cycle peaks, increased 0.1 percent over July on a three-month moving average (3MMA) basis, marking its fourth consecutive monthly gain. The barometer is now up 3.8 percent over a year ago, the largest year-over-year increase since September 2010. The index itself is at its highest point since June 2008. Prior CAB readings for March through July were all revised.

“As we approach the fourth quarter, the U.S. economy seems to be making strides, compared to the baby steps of earlier in the year,” said Dr. Kevin Swift, chief economist at the American Chemistry Council. “The Chemical Activity Barometer is showing a strengthening of year-over-year growth and suggests an economy which finally may be gaining momentum,” he added.
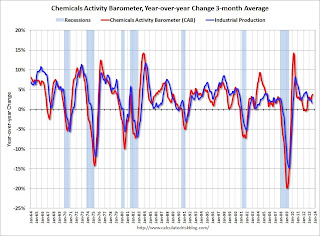
Chemical Activity Barometer Click on graph for larger image.

This graph shows the year-over-year change in the 3-month moving average for the Chemical Activity Barometer compared to Industrial Production.  It does appear that CAB (red) generally leads Industrial Production (blue).

And this suggests that economic activity is increasing.

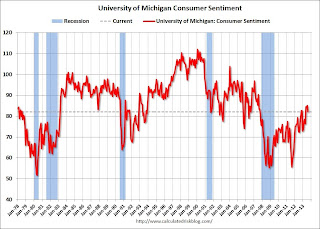
Final August Consumer Sentiment at 82.1

Consumer Sentiment
Click on graph for larger image.

The final Reuters / University of Michigan consumer sentiment index for August was at 82.1, down from the July reading of 85.1, but up from the preliminary August reading of 80.0.

This was above the consensus forecast of 80.0. Sentiment has generally been improving following the recession - with plenty of ups and downs - and one big spike down when Congress threatened to "not pay the bills" in 2011.  Unfortunately Congress is once again threatening to "not pay the bills" and that might impact sentiment (and consumer spending) late in September or in October.

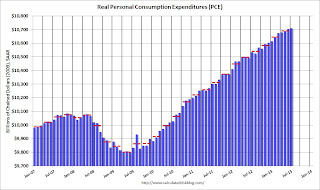
Personal Income increased 0.1% in July, Spending increased 0.1%

The BEA released the Personal Income and Outlays report for July:
Personal income increased $14.1 billion, or 0.1 percent, ... in July, according to the Bureau of Economic Analysis. Personal consumption expenditures (PCE) increased $16.3 billion, or 0.1 percent.
...
Real PCE -- PCE adjusted to remove price changes -- increased less than 0.1 percent in July, compared with an increase of 0.2 percent in June. ... The price index for PCE increased 0.1 percent in July, compared with an increase of 0.4 percent in June. The PCE price index, excluding food and energy, increased 0.1 percent, compared with an increase of 0.2 percent.
Core PCE increased at a 2.6% annual rate in July, but only a 1.2% annual rate in Q2.

The following graph shows real Personal Consumption Expenditures (PCE) through July (2009 dollars). Note that the y-axis doesn't start at zero to better show the change.

Personal Consumption Expenditures Click on graph for larger image.

The dashed red lines are the quarterly levels for real PCE.

This is a slow start to Q3.

On inflation, the PCE price index increased at a 1.1% annual rate in July, and core PCE prices increased only at a 0.9% annual rate.

The Billionaire's Gift by Edward Iwata

Lifesize/Thinkstock
My friend and colleague Edward Iwata wrote another e-book, "The Billionaire's Gift:  A Spiritual Business Parable," his debut fiction and available at the Amazon Kindle Store.

Here's what a reviewer said about the book:

"Edge-of-your-seat drama to the very end will promise to sweeten your soul and change your outlook for the better."

Here's what Edward says about his book:
IN A CRAZED and chaotic world, I'm grateful to God and Buddha for helping many of us find a higher purpose in life. The Billionaire's Gift is about seeking one's calling. There is no doubt in my mind that everyone in a free society can choose our destinies and cultivate our talents. Each of us - rich and poor, young and old - can bear a gift to share with others.

A recent personal episode - one of many encouraging signs that appeared while I wrote The Billionaire's Gift - confirmed my belief that I've rediscovered ...
Grab a copy of Edward's book here.

We featured Edward's first business e-book, "Fusion Entrepreneurs;  Cross-Cultural Execs and Companies Revolutionizing the Global Economy," September 2012.

Thursday, August 29, 2013

Friday: July Personal Income and Outlays, Chicago PMI, Consumer Sentiment

Back in June I posted four charts that I'm using to track when the Fed will start tapering the QE3 purchases.

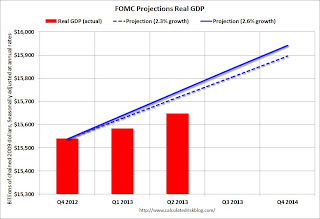
 Here is an update to the GDP chart including the 2nd estimate of GDP released this morning (Q2 GDP growth was revised up to annual rate of 2.5% from the 1.7% advance estimate). Note: Here are the most recent updates to the four charts. I'll update two more charts tomorrow (PCE and core inflation).

At the June FOMC press conference, Fed Chairman Ben Bernanke said:
"If the incoming data are broadly consistent with this forecast, the Committee currently anticipates that it would be appropriate to moderate the monthly pace of purchases later this year. And if the subsequent data remain broadly aligned with our current expectations for the economy, we would continue to reduce the pace of purchases in measured steps through the first half of next year, ending purchases around midyear. In this scenario, when asset purchases ultimately come to an end, the unemployment rate would likely be in the vicinity of 7%, with solid economic growth supporting further job gains, a substantial improvement from the 8.1% unemployment rate that prevailed when the committee announced this program."
FOMC Projection GDP Tracking Click on graph for larger image.

The current forecast is for GDP to increase between 2.3% and 2.6% from Q4 2012 to Q4 2013.

Combined the first and second quarter were below the FOMC projections. GDP would have to increase at a 2.8% annual rate in the 2nd half to reach the FOMC lower projection, and at a 3.3% rate to reach the higher projection.

Friday:
• 8:30 AM ET, Personal Income and Outlays for July. The consensus is for a 0.2% increase in personal income in June, and for a 0.3% increase in personal spending. And for the Core PCE price index to increase 0.2%.

• At 9:45 AM, the Chicago Purchasing Managers Index for August. The consensus is for an increase to 53.0, up from 52.3 in July.

• At 9:55 AM, the Reuter's/University of Michigan's Consumer sentiment index (final for July). The consensus is for a reading of 80.0.

Lawler: Regulators “Caving” on QRM

From housing economist Tom Lawler:

Six federal agencies on Wednesday issued a notice revising a proposed rule requiring sponsors of securitization transactions to retain risk in those transactions. The new proposal revises a proposed rule the agencies issued in 2011 to implement the risk retention requirement in the Dodd-Frank Wall Street Reform and Consumer Protection Act (Dodd-Frank Act) .

After intense lobbying and political pressure, the agencies have reluctantly agreed “to define QRMs to have the same meaning as the term qualified mortgages as defined by the Consumer Financial Protection Bureau.” The agencies also changed its original proposal that risk-retention requirements would be based on the par value of securities issued and included a “premium recapture provision; the new proposal has risk retention based on “fair value measurements without a premium capture provision.”

The agencies requested comments on whether an alternative definition of QRM should include “certain underwriting standards in addition to the qualified mortgage criteria.” With the exception of the DTI and verification requirements, the QM doesn’t really have underwriting “standards related to risk.

The “Dodd-Frank Act” had, among other things, two “definitions” of mortgages: “qualified mortgages,” to be defined by the CFPB and focusing on a borrower’s “ability to pay;” and “qualified residential mortgages,” to be defined by six regulatory agencies, focusing on mortgages with underwriting and product features related to the probability of default. A “qualified mortgage” would give lenders something of a “safe harbor” against future litigation, while a “qualified residential mortgage” would be exempt from risk-retention requirements associated with issuing mortgage-backed securities.

In setting the “qualified mortgage” definition, the CFPB focused on (1) product features); (2) up-front fees charged; (3) verification of relevant borrower information; and (4) a maximum backend debt-to-income ratio (and implicitly a maximum front-end ratio) of 43% (with some exceptions). While the CFPB gave a list of factors creditors must consider in determining a borrower’s ability to pay, it did not dictate that creditors follow any particular underwriting model. In defining a “QM” the CFPB did not take into account many extremely important variables/factors that impact the probability that a mortgagor will default.

The original intent of the Dodd-Frank “risk retention” rule was to make sure that issuers/originators had “skin in the game,” which it was hoped would better align the interests of issuers/originators and investors. Mortgage and real-estate industry lobbyists argued that “low-risk” mortgages should be exempt from the risk-retention requirement. While this exemption didn’t make any sense – after all, the proposed legislation required a 5% retention of “risk,” meaning that issuers/originators of “low-risk” mortgages backing a private-label MBS would have to retain 5% of a “low” amount of risk -- legislators succumbed to the lobbying and introduced the “QRM” concept into the final Dodd-Frank bill – relegating the definition to regulatory agencies, but requiring that QRMs be mortgages with “underwriting and product features that historical loan performance data indicate result in a lower risk of default.”

In their preliminary proposed definition of a “QRM,” regulators tried to define a QRM as a mortgage with so little risk that risk-retention to ensure mortgage players would have “skin in the game” was “unimportant.” Not surprisingly, the original proposed definition of a QRM included a hefty (20% down) down payment, a DTI no greater than 36%, had restrictions on a borrower’s credit, and excluded most of the loan features excluded from a QM.

The real estate and mortgage industry lobbyists who had argued for a QRM exemption were stunned, even though the regulators’ “framework” of (1) assuming that risk-retention was a “good thing” (and should be applied to the bulk of mortgages backing private-label RMBS), and (2) only “extremely” low risk mortgages should be exempted from this requirement made perfect sense.

Real estate and mortgage industry folks started lobbying hard against this QRM proposal, and (1) massively inflated the “costs” to issuers/originators of the risk-retention requirement – which would be based on to consumers; (2) argued that many potential borrowers would be excluded from getting mortgage credit; and (3) argued that having a QM definition that differed from a QRM definition would add to the growing regulatory burden being placed on mortgage lenders, and lobbied extremely hard to make the two definitions the same – even though the legislation explicitly differentiated between the two. This latter argument was mildly humorous, in that the only reason the legislation HAD both a QM and a QRM was because of real estate and mortgage industry lobbyists!

An alternative and more logical approach would have been for regulators to decide that there simply WAS no mortgage that was so inherently low risk that it made sense to exempt such a mortgage from the risk-retention requirement, which would effectively have eliminated the concept of a QRM. If they had done so, then the “burden” on the industry of having both a QM and a QRM would have been lifted.

Making the QM and the QRM essentially the same pretty much violates the intent of the Dodd-Frank law, in that the QM definition has very little to do with risk, while the QRM was explicitly supposed to be related to risk. E.g., a 30-year fully amortizing loan with no down payment to a borrower with a FICO score of 580, no current debt outstanding but also hardly any assets, and a front-end debt-to-income ratio of 43% would be deemed a qualified mortgage, even though by any standard such a mortgage would be viewed as extremely risky! An interest-only loan to an extremely wealthy borrower with an 800 credit score who made a 40% down payment would not be a QM.

If the current proposal is finalized as is, then the risk-retention requirement for private-label RMBS, which was very explicitly designed to better align the interests of issuers/originators and investors, will effectively be gone.

That may not be bad, in that it was not clear if a 5% risk-retention requirement would really alter behavior. However, risk retention was a clear INTENT of legislators in Dodd-Frank, and real-estate and mortgage lobbyists have effectively eliminated it for the vast bulk of mortgages that will be originated.
FDIC reports $42.2 Billion Earnings for Insured Institutions, Fewer Problem banks, Residential REO Declines in Q2

The FDIC reported FDIC-Insured Institutions Earned $42.2 Billion in the Second Quarter of 2013
Commercial banks and savings institutions insured by the Federal Deposit Insurance Corporation (FDIC) reported aggregate net income of $42.2 billion in the second quarter of 2013, a $7.8 billion (22.6 percent) increase from the $34.4 billion in profits that the industry reported a year earlier. This is the 16th consecutive quarter that earnings have registered a year-over-year increase. Increased noninterest income, lower noninterest expenses, and reduced provisions for loan losses accounted for the increase in earnings from a year ago.
The FDIC reported the number of problem banks declined:
The number of problem banks continued to decline. The number of banks on the FDIC's "Problem List" declined from 612 to 553 during the quarter. The number of "problem" banks is down nearly 40 percent from the recent high of 888 institutions at the end of first quarter 2011. Twelve FDIC-insured institutions failed in the second quarter of 2013, up from four failures in the first quarter. Thus far in 2013, there have been 20 failures, compared to 40 during the same period in 2012.
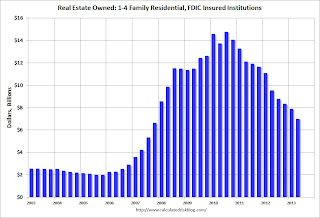
FDIC Insured Institution REO Click on graph for larger image.

This graph shows the dollar value of Residential REO for FDIC insured institutions. Note: The FDIC reports the dollar value and not the total number of REOs.

The dollar value of 1-4 family residential Real Estate Owned (REOs, foreclosure houses) declined from $7.89 billion in Q1 to $6.98 Billion in Q2. This is the lowest level of REOs since Q4 2007.  The dollar value of FDIC insured REO peaked at $14.8 Billion in Q3 2010.

Even in good times, the FDIC insured institutions have about $2.5 billion in residential REO, so the FDIC insured institutions are about two-thirds of the way back to normal levels.

Zillow: Negative Equity declines in Q2

Note: CoreLogic will release their Q2 negative equity report in the next couple of weeks. For Q1, CoreLogic reported there were 9.7 million properties with negative equity, and that will be down further in Q2.

From Zillow: Negative Equity Rate Falls for 5th Straight Quarter in Q2
According to the second quarter Zillow Negative Equity Report, the national negative equity rate continued to fall in the second quarter, dropping to 23.8% of all homeowners with a mortgage from 25.4% in the first quarter of 2013. The negative equity rate has been continually falling for the past five quarters, with the second quarter of 2013 being down significantly from the second quarter of 2012 at 30.9% – a decrease of more than 7 percentage points. In the second quarter of 2013, more than 805,000 American homeowners were freed from negative equity. However, more than 12 million homeowners with a mortgage remain underwater ... Of all homeowners – roughly one-third of homeowners do not have a mortgage and own their homes free and clear – 16.7% are underwater.
emphasis added
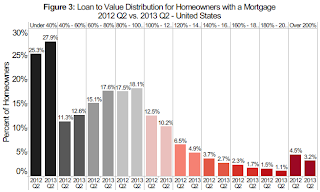
The following graph from Zillow shows negative equity by Loan-to-Value (LTV) in Q2 2013 compared to Q2 2012.

Zillow Negative EquityClick on graph for larger image.

From Zillow:
Figure 3 shows the loan-to-value (LTV) distribution for homeowners with a mortgage in the nation in 2013 Q2 vs. 2012 Q2. Even though many homeowners are still underwater and haven’t crossed the 100% LTV threshold to enter into positive equity, they are moving in the right direction. ... On average, a U.S. homeowner in negative equity owes $74,700 more than what their house is worth, or 42.3% more than the home’s value.  While roughly a quarter of homeowners with a mortgage are underwater, 92% of these homeowners are current on their mortgages and continue to make payments.
Almost half of the borrowers with negative equity have a LTV of 100% to 120% (the light red columns). Most of these borrowers are current on their mortgages - and they have probably either refinanced with HARP or the loans are well seasoned (most of these properties were purchased in the 2004 through 2006 period, so borrowers have been current for eight years or so). In a few years, these borrowers will have positive equity.

The key concern is all those borrowers with LTVs above 140% (about 8.7% of properties with a mortgage according to Zillow). It will take many years to return to positive equity ... and a large percentage of these properties will eventually be distressed sales (short sales or foreclosures).

Q2 GDP Revised up to 2.5%, Weekly Initial Unemployment Claims decline to 331,000

From the BEA:
Real gross domestic product -- the output of goods and services produced by labor and property located in the United States -- increased at an annual rate of 2.5 percent in the second quarter of 2013 (that is, from the first quarter to the second quarter), according to the "second" estimate released by the Bureau of Economic Analysis. ... In the advance estimate, the increase in real GDP was 1.7 percent.

The upward revision to the percent change in real GDP primarily reflected an upward revision to exports, a downward revision to imports, and an upward revision to private inventory investment that were partly offset by a downward revision to state and local government spending.
• The DOL reports:
In the week ending August 24, the advance figure for seasonally adjusted initial claims was 331,000, a decrease of 6,000 from the previous week's revised figure of 337,000. The 4-week moving average was 331,250, an increase of 750 from the previous week's unrevised average of 330,500.
The previous week was revised up from 336,000.

The following graph shows the 4-week moving average of weekly claims since January 2000.

Click on graph for larger image.


The dashed line on the graph is the current 4-week average. The four-week average of weekly unemployment claims increased to 331,250.

The 4-week average is near the lowest level since November 2007 (before the recession started).  Claims were close to the 330,000 consensus forecast.

Wednesday, August 28, 2013

From Saks to Sears, Retailers Are Going Global Like Gangbusters

iStockphoto/Thinkstock
Right now, it might be a small base of business for retailers but going global offers huge upside growth potential for companies who get e-commerce right at the outset.  The most complicated part?  Calculating a landed price for consumers online at checkout.  But even that challenge can be overcome.
Global ecommerce for physical goods outside the U.S. is expected to grow at an annual rate of 18% from 2012, reaching $640 billion by 2017, and outpacing projected annual growth of 7% in the U.S. during the same period ...
Read the entire article:  Virtual bazaar:  How U.S. retailers from Sears to Saks are going global

Thursday: Q2 GDP (second estimate), Unemployment Claims

An interesting article from Shaila Dewan at the NY Times: Tensions on the Cul-de-Sac
Across the country, a growing number of single-family rentals provide an option for many who lost their homes in the housing crash through foreclosure and for those who cannot obtain a mortgage under today’s tougher credit conditions. But the decline in homeownership is also changing many neighborhoods in profound ways, including reduced home values, lower voter turnout and political influence, less social stability and higher crime.

“When there are fewer homeowners, there is less ‘self-help,’ like park and neighborhood cleanup, neighborhood watch,” said William M. Rohe, a professor at the University of North Carolina at Chapel Hill who has just completed a review of current research on homeownership’s effects.

Even conscientious landlords and tenants invest less in their property than owner-occupants, he said. “Who’s going to paint the outside of a rental house? You’d almost have to be crazy.”
Thursday:
• 8:30 AM ET, The initial weekly unemployment claims report will be released. The consensus is for claims to decrease to 330 thousand from 336 thousand last week.

• Also at 8:30 AM, Q2 GDP (second estimate). This is the second estimate of Q2 GDP from the BEA. The consensus is that real GDP increased 2.2% annualized in Q2, revised up from the advance estimate of 1.7% in Q2

• Note: The FDIC Q2 Quarterly Banking Profile could be released tomorrow or Friday.

Freddie Mac: Mortgage Serious Delinquency rate declined in July, Lowest since April 2009

Freddie Mac reported that the Single-Family serious delinquency rate declined in July to 2.70% from 2.79% in June. Freddie's rate is down from 3.42% in July 2012, and this is the lowest level since April 2009. Freddie's serious delinquency rate peaked in February 2010 at 4.20%.

These are mortgage loans that are "three monthly payments or more past due or in foreclosure". 

Very few seriously delinquent loans cure with the owner making up back payments - most of the reduction in the serious delinquency rate is from foreclosures, short sales, and modifications.

I'm frequently asked when the distressed sales will be back to normal levels, and that will happen when the percent of seriously delinquent loans (and in foreclosure) is back to normal.

Note: Fannie Mae will report their Single-Family Serious Delinquency rate for July next week.

Fannie Freddie Seriously Delinquent RateClick on graph for larger image

Although this indicates some progress, the "normal" serious delinquency rate is under 1%. 

At the recent rate of improvement, the serious delinquency rate will not be under 1% until 2016 or so.  Therefore I expect a fairly high level of distressed sales for 2 to 3 more years (mostly in judicial states).

Dean Baker: "Rising Mortgage Rates Did Not Affect June Case-Shiller Data"

Dean Baker beat me to this: Rising Mortgage Rates Did Not Affect June Case-Shiller Data
The Washington Post ... article today on the Case-Shiller June price index attributed the slower price growth in part to higher interest rates. This makes no sense.

The Case-Shiller index is an average of three months data. The June release is based on the price of houses that were closed in April, May, and June. Since there is typically 6-8 weeks between when a contract is signed and when a sale is completed these houses would have come under contract in the period from February to May. This is a period before there was any real rise in interest rates.

... We will first begin to see a limited impact of higher interest rates in the Case Shilller index in the July data and the impact of the rise will not be fully apparent until the October index is released.
One addition: we will not see any impact of higher mortgage rates until at least the "August" Case-Shiller report is released (see earlier post), and - as Baker notes - the impact will not be fully apparent in the Case-Shiller index until the "October" report is released because of the 3 month average. However other prices indexes - like Zillow and LPS - will pick up any impact sooner.

Zillow: Case-Shiller House Price Index expected to show 12.5% year-over-year increase in July

The Case-Shiller house price indexes for June were released yesterday. Zillow has started forecasting Case-Shiller a month early - and I like to check the Zillow forecasts since they have been pretty close. Note: Zillow makes a strong argument that the Case-Shiller index is currently overstating national house price appreciation.

Another 12% Hike Predicted for July Case-Shiller Indices
The Case-Shiller data for June (2013 Q2) came out [yesterday] and, based on this information and the July 2013 Zillow Home Value Index (released last week), we predict that next month’s Case-Shiller data (July 2013) will show that the 20-City Composite Home Price Index (non-seasonally adjusted [NSA]), as well as the 10-City Composite Home Price Index (NSA) increased 12.5 percent on a year-over-year basis. The seasonally adjusted (SA) month-over-month change from June to July will be 1.0 percent for the 20-City Composite and 1.2 percent for the 10-City Composite Home Price Indices (SA). All forecasts are shown in the table below. Officially, the Case-Shiller Composite Home Price Indices for June will not be released until Tuesday, September 24.
...
As home value appreciation is beginning to moderate, the Case-Shiller indices will continue to show an inflated sense of national home value appreciation. First signs of a slowdown in monthly appreciation are present, although these slowdowns are fairly timid. The Case-Shiller indices are biased toward the large, coastal metros currently seeing enormous home value gains, and they include foreclosure resales. The inclusion of foreclosure resales disproportionately boosts the index when these properties sell again for much higher prices — not just because of market improvements, but also because the sales are no longer distressed. In contrast, the ZHVI does not include foreclosure resales and shows home values for July 2013 up 6 percent from year-ago levels. We expect home value appreciation to continue to moderate through the end of 2013 and into 2014, rising 4.8 percent between July 2013 and July 2014. The main drivers of this moderation include rising mortgage rates, less investor participation – decreasing demand – and increasing for-sale inventory supply. Further details on our forecast of home values can be found here, and more on Zillow’s full July 2013 report can be found here.
...
To forecast the Case-Shiller indices, we use the June Case-Shiller index level, as well as the July Zillow Home Value Index (ZHVI), which is available more than a month in advance of the Case-Shiller index, paired with July foreclosure resale numbers, which Zillow also publishes more than a month prior to the release of the Case-Shiller index. Together, these data points enable us to reliably forecast the Case-Shiller 10-City and 20-City Composite indices.
The following table shows the Zillow forecast for the July Case-Shiller index.

Zillow July Forecast for Case-Shiller Index
 Case Shiller Composite 10Case Shiller Composite 20
NSASANSASA
Case Shiller
(year ago)
July 2012157.21154.35144.58141.81
Case-Shiller
(last month)
June 2013173.37172.25159.54158.32
Zillow ForecastYoY12.5%12.5%12.5%12.5%
MoM2.0%1.2%1.9%1.2%
Zillow Forecasts1 176.8174.0162.6159.9
Current Post Bubble Low 146.46149.62134.07136.88
Date of Post Bubble Low Mar-12Jan-12Mar-12Jan-12
Above Post Bubble Low 20.7%16.3%21.3%16.8%
1Estimate based on Year-over-year and Month-over-month Zillow forecasts

NAR: Pending Home Sales index declined 1.3% in July

From the NAR: July Pending Home Sales Slip
The Pending Home Sales Index, a forward-looking indicator based on contract signings, declined 1.3 percent to 109.5 in July from 110.9 in June, but is 6.7 percent above July 2012 when it was 102.6; the data reflect contracts but not closings. Pending sales have stayed above year-ago levels for the past 27 months.
...
The PHSI in the Northeast fell 6.5 percent to 81.5 in July but is 3.3 percent higher than a year ago. In the Midwest the index slipped 1.0 percent to 113.2 in July but is 14.5 percent above July 2012. Pending home sales in the South rose 2.6 percent to an index of 121.5 in July and are 7.7 percent higher than a year ago. The index in the West fell 4.9 percent in July to 108.6, and is 0.4 percent below July 2012.
Contract signings usually lead sales by about 45 to 60 days, so this would usually be for closed sales in August and September.

Note: It appears some buyers pushed to close in July because of rising mortgage rates (People who signed contracts in May probably locked in mortgage rates, and they wanted to close before the lock expired).  So I expect closed sales in August to decline more than the pending home sales index would indicate.

MBA: Mortgage Refinance Applications down, Purchase Applications Up in Recent Survey

From the MBA: Mortgage Applications Decrease in Latest MBA Weekly Survey
Mortgage applications decreased 2.5 percent from one week earlier, according to data from the Mortgage Bankers Association’s (MBA) Weekly Mortgage Applications Survey for the week ending August 23, 2013. ...

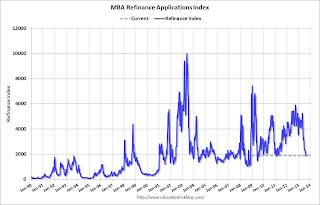
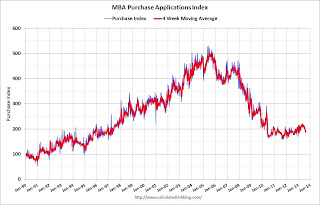
The Refinance Index decreased 5 percent from the previous week. The Refinance Index has fallen 64.2 percent from its recent peak the week of May 3, 2013. The seasonally adjusted Purchase Index increased 2 percent from one week earlier.
...
The refinance share of mortgage activity decreased to 60 percent of total applications from 61 percent the previous week, which is the lowest share observed since April 2011. ...

The average contract interest rate for 30-year fixed-rate mortgages with conforming loan balances ($417,000 or less) increased to 4.80 percent, the highest rate since April 2011, from 4.68 percent, with points decreasing to 0.41 from 0.42 (including the origination fee) for 80 percent loan-to-value ratio (LTV) loans.
emphasis added
Mortgage Refinance Index Click on graph for larger image.

The first graph shows the refinance index.

Refinance activity has fallen sharply, decreasing in 14 of the last 16 weeks.

This index is down 64.2% over the last 16 weeks.   The last time the index declined this far was in late 2010 and early 2011 when mortgage increased sharply with the Ten Year Treasury rising from 2.5% to 3.5%.  We've seen a similar increase over the last few months with the Ten Year Treasury yield up from 1.6% to over 2.7% today.

Mortgage Purchase Index The second graph shows the MBA mortgage purchase index.   The purchase index has increased for the last two weeks, and three of the last four.

The 4-week average of the purchase index has generally been trending up over the last year (but down over the couple of months), and the 4-week average of the purchase index is up about 6.7% from a year ago. 

Guys and Gals: Startup Your Business Global

iStockphoto/Thinkstock
As we write about constantly here at this blog, the world is your market and - thanks to the Internet, you can tap into it from day one with your startup.

According to HBS Associate Professor William R. Kerr:
But building a startup as a global business requires managers with skills and strategy much different from their predecessors of even a generation ago. If you are a global entrepreneur, says Harvard Business School Associate Professor William R. Kerr, "you have to think much earlier and much faster."
 Read the entire article:  Built for Global Competition from the Start

Related article: Launching Your Start-Up Globally

Side note:  I've been writing a new book on exporting to be published December 2013 by Apress.  I talk a lot about the concept of "born global" in it.  I'll keep you posted when it is close to official publication date.

Tuesday, August 27, 2013

Wednesday: Mortgage Applications, Pending Home Sales Index

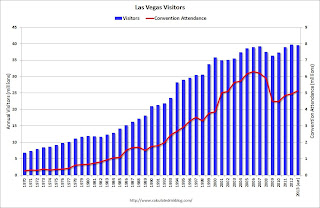
Just an update ... during the recession, I wrote about the troubles in Las Vegas and included a chart of visitor and convention attendance: Lost Vegas.

Since then Las Vegas visitor traffic recovered to a new record high in 2012.

However convention attendance in 2012 was still about 21% below the peak level in 2006.  Here is the data from the Las Vegas Convention and Visitors Authority.  


Las Vegas Click on graph for larger image.

The blue bars are annual visitor traffic (left scale), and the red line is convention attendance (right scale).   The numbers for 2013 are a projection based on data through June.

So far this year - through June - there were 19.9 million visitors to Las Vegas - slightly less than for the first six months of 2012. 

Convention attendance was at 2.9 million during the first half of 2013, for a pace over 5 million for the first time since 2008 - but still well below the record of 6.3 million in 2006.

Wednesday:
• 7:00 AM ET, the Mortgage Bankers Association (MBA) will release the results for the mortgage purchase applications index. With higher mortgage rates, the refinance index has fallen sharply over the last few months. The key will be to watch the purchase application index.

• At 10:00 AM, the NAR will release the Pending Home Sales Index for July. The consensus is for a 1.0% decrease in the index.

Lawler: Measuring Changes in Home Prices is Difficult!

From housing economist Tom Lawler:

Below is a table showing the latest YOY % changes in various entities’ home price indexes for the metro areas covered in today’s Case Shiller home price report, as well as “national” HPIs. The YOY changes are for the period ended in June, with Case-Shiller, FHFA expanded, and Zillow effectively being quarterly averages; CoreLogic a weighted 3-month moving average; and LPS and FNC being “June.” Zillow does not include foreclosure resales in constructing its HVI, while LPS’ HPI “reflects” non-distressed sales, as it “takes into account” price discounts for REO and short sales. FNC’s RPI is a “hedonic” price index, as is (pretty much) Zillow’s HVI. CoreLogic produces HPIs for all of the metro areas below, but only releases to the public the ones shown below. Note that in some cases (e.g., NY), Case-Shiller’s “metro area” definition differs from the other entities (it is broader).

The biggest “outliers” are the “hedonic” home price indexes, which attempt to take into account the characteristics of homes sold. FNC’s RPI for many metro areas seem “most strange” – the RPIs for DC and Portland showed virtually no change from a year ago, which just doesn’t seem right. And FNC’s “national” (100 metro area) RPI gain of 3.7% over the last year seems way too low.

Even if all of the metro/regional/state HPIs from these entities “matched up,” the various entities’ “national” HPIs would show different growth rates. Case-Shiller constructs a “national” HPI from Census division HPIs with weights based on each division’s share of the market value of the housing stock from Census 2000. FHFA constructs a “national” HPI using weights based on state shares of the housing stock in units using the latest available ACS data. CoreLogic does not “build up” a national HPI from regional HPIs, but instead aggregates all transactions across the county. Zillow’s HVI is a “median” home-value measure, I believe using all homes for which it has a “Zestimate.” I’m not rightly sure how LPS or FNC construct their “national” HPIs.

The method used to construct a “national” HPI from state/regional HPIs can have a material impact. As I noted last week, if CoreLogic used Census 2000 market value weight applied to its state HPIs, its “national” HPI for June would have been up 9.4% YOY, compared to the reported 11.9%. And if the FHFA had applied Census 2000 market value weights to its state HPIs, its “national” HPI for June would have bee up 8.1%, instead of the reported 7.6%. The Case Shiller “national” HPI for “June” (Q2) was up 10.1% YOY. Case-Shiller doesn’t produce state HPIs and doesn’t release its Census division HPIs to the public.

YOY % Change, Various Home Price Indexes ("June"/Q2 2013)
 Case-ShillerFHFA ExpandedCoreLogicLPSFNCZillow
AZ-Phoenix19.8%21.2%17.1%16.6%27.5%22.0%
CA-Los Angeles19.9%18.3%20.7%18.8%7.8%19.7%
CA-San Diego19.3%17.5%19.9%18.0%9.1%21.8%
CA-San Francisco24.5%19.7% 23.9%10.2%26.3%
CO-Denver9.4%10.3%10.5%9.8%8.8%12.7%
DC-Washington5.7%9.9%9.4%7.7%0.8%7.0%
FL-Miami14.8%13.4%13.4%14.3%5.8%12.5%
FL-Tampa11.1%11.7%9.4%11.0%5.9%10.6%
GA-Atlanta19.0%18.6%16.1%13.0%2.7%6.5%
IL-Chicago7.3%6.7%4.6%6.8%-1.0%1.1%
MA-Boston6.7%7.5% 6.4%3.0%6.7%
MI-Detroit16.4%15.2% 11.3%6.3%15.1%
MN-Minneapolis11.5%10.2%9.1%8.4%4.4%11.7%
NC-Charlotte7.8%8.5% 6.3%5.3%1.9%
NV-Las Vegas24.9%24.5% 27.0%18.6%29.5%
NY-New York3.3%2.6%7.2%4.2%0.2%1.8%
OH-Cleveland3.5%3.1% 3.5%0.9%3.2%
OR-Portland11.8%13.8%14.6%10.3%0.9%13.3%
TX-Dallas8.0%9.0%9.9%6.5%7.4%6.0%
WA-Seattle11.8%14.9%15.1%11.9%2.9%13.0%
“National”10.1%7.6%11.9%8.4%3.7%5.6%

Richmond Fed: "Manufacturing Sector Strengthened, Hiring Remained Modest" in August

From the Richmond Fed: Manufacturing Sector Strengthened, Hiring Remained Modest
The composite index of manufacturing activity rebounded in August, climbing twenty-five points above the July reading to 14. The components of that index all rose this month, with the index for shipments jumping to 17 from the previous reading of −15 and the index for new orders moving to 16 from −15. ...

The index for the number of employees moved up to 6 in August following a flat reading a month ago. The indicator for the average manufacturing workweek also gained, picking up six points to post a reading of 8. In addition, average wage growth intensified, pushing the index to 13 from July's reading of 8.

Manufacturers were decidedly upbeat about business prospects for the next six months. The index for expected shipments rose to 36 from July's reading of 24, and the indicator for the volume of new orders added nine points to last month's index to finish the month at a reading of 33. ...
...
Manufacturers planned to increase hiring in the six months ahead; the marker for the number of employees picked up four points to settle at 9, while the index for the average workweek moved up to 10 from last month's reading of 8. Employers also anticipated robust wage growth, pushing that index to 28 in August from 21.
emphasis added
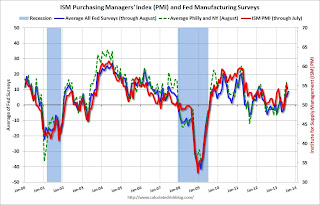
Here is a graph comparing the regional Fed surveys and the ISM manufacturing index:

Fed Manufacturing Surveys and ISM PMI Click on graph for larger image.

The New York and Philly Fed surveys are averaged together (dashed green, through August), and five Fed surveys are averaged (blue, through August) including New York, Philly, Richmond, Dallas and Kansas City. The Institute for Supply Management (ISM) PMI (red) is through July (right axis).

All of the regional surveys showed expansion in August, and overall at about the same pace as in July.  The ISM index for July will be released next Tuesday, Sept 3rd.

Comment on House Prices: Real Prices, Price-to-Rent Ratio, Cities

Two key points:

• The Case-Shiller index released this morning was for June, and it is actually a 3 month of average prices in April, May and June. I think price increases have slowed recently based on agent reports (a combination of a little more inventory and higher mortgage rates), but this slowdown in price increases will not show up for several months in the Case-Shiller index because of the reporting lag and because of the three month average. I expect to see smaller year-over-year price increases going forward and some significant deceleration towards the end of the year. 

• It appears the Case-Shiller index is currently overstating price increases for most homeowners, both because of the handling of distressed sales and the weighting of some coastal areas.

I also think it is important to look at prices in real terms (inflation adjusted).  Case-Shiller, CoreLogic and others report nominal house prices.  As an example, if a house price was $200,000 in January 2000, the price would be close to $275,000 today adjusted for inflation. 

Earlier: Case-Shiller: Case-Shiller: Comp 20 House Prices increased 12.1% year-over-year in June

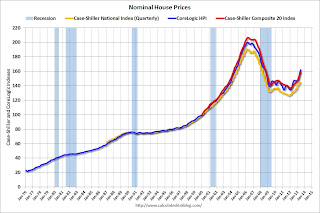
Nominal House Prices

Nominal House PricesThe first graph shows the quarterly Case-Shiller National Index SA (through Q2 2013), and the monthly Case-Shiller Composite 20 SA and CoreLogic House Price Indexes (through June) in nominal terms as reported.

In nominal terms, the Case-Shiller National index (SA) is back to Q4 2003 levels (and also back up to Q4 2008), and the Case-Shiller Composite 20 Index (SA) is back to April 2004 levels, and the CoreLogic index (NSA) is back to August 2004.

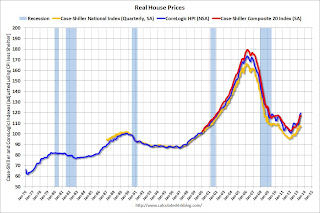
Real House Prices

Real House PricesThe second graph shows the same three indexes in real terms (adjusted for inflation using CPI less Shelter). Note: some people use other inflation measures to adjust for real prices.

In real terms, the National index is back to Q4 2000 levels, the Composite 20 index is back to November 2001, and the CoreLogic index back to March 2002.

In real terms, house prices are back to early '00s levels.

Price-to-Rent

In October 2004, Fed economist John Krainer and researcher Chishen Wei wrote a Fed letter on price to rent ratios: House Prices and Fundamental Value. Kainer and Wei presented a price-to-rent ratio using the OFHEO house price index and the Owners' Equivalent Rent (OER) from the BLS.

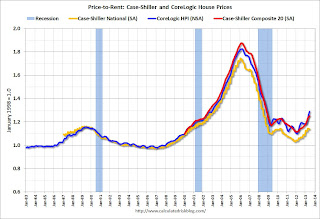
Price-to-Rent RatioHere is a similar graph using the Case-Shiller National, Composite 20 and CoreLogic House Price Indexes.

This graph shows the price to rent ratio (January 1998 = 1.0).

On a price-to-rent basis, the Case-Shiller National index is back to Q4 2000 levels, the Composite 20 index is back to April 2002 levels, and the CoreLogic index is back to December 2002.

In real terms - and as a price-to-rent ratio - prices are mostly back to early 2000 levels.

Nominal Prices: Cities relative to Jan 2000


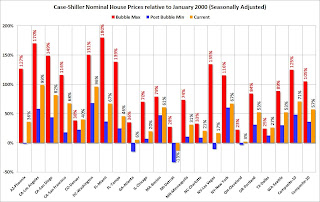
Case-Shiller CitiesThe last graph shows the bubble peak, the post bubble minimum, and current nominal prices relative to January 2000 prices for all the Case-Shiller cities in nominal terms.

As an example, at the peak, prices in Phoenix were 127% above the January 2000 level. Then prices in Phoenix fell slightly below the January 2000 level, and are now up 36% above January 2000.  Two cities - Denver and Dallas - are at new highs (no other Case-Shiller Comp 20 city is close).  Detroit prices are still below the January 2000 level.

Case-Shiller: Comp 20 House Prices increased 12.1% year-over-year in June

S&P/Case-Shiller released the monthly Home Price Indices for June ("June" is a 3 month average of April, May and June prices).

This release includes prices for 20 individual cities, two composite indices (for 10 cities and 20 cities) and the Q2 National index.

Note: Case-Shiller reports Not Seasonally Adjusted (NSA), I use the SA data for the graphs.

From S&P: Home Prices Continue Climbing in June 2013 According to the S&P/Case-Shiller Home Price Indices
Data through June 2013, released today by S&P Dow Jones Indices for its S&P/Case-Shiller1Home Price Indices ... showed that prices continue to increase. The National Index grew 7.1% in the second quarter and 10.1% over the last four quarters. The 10-City and 20-City Composites posted returns of 2.2% for June and 11.9% and 12.1% over 12 months. ...

All 20 cities posted gains on a monthly and annual basis. However, in only six cities were prices rising faster this month than last, compared to ten in May. Dallas and Denver reached new all-time highs as they did last month, with returns of +1.7% each in June. ...

“Overall, the report shows that housing prices are rising but the pace may be slowing. Thirteen out of twenty cities saw their returns weaken from May to June. As we are in the middle of a seasonal buying period, we should expect to see the most gains. With interest rates rising to almost 4.6%, home buyers may be discouraged and sharp increases may be dampened." [says David M. Blitzer, Chairman of the Index Committee at S&P Dow Jones Indices]

All 20 cities showed positive monthly returns for at least the third consecutive month. Six cities – Charlotte, Cleveland, Las Vegas, Minneapolis, New York and Tampa – showed acceleration. Atlanta took the lead with a return of 3.4% as San Francisco dropped to +2.7% in June from +4.3% in May. New York posted a gain of 2.1%, its highest since July 2002.
Case-Shiller House Prices Indices Click on graph for larger image.

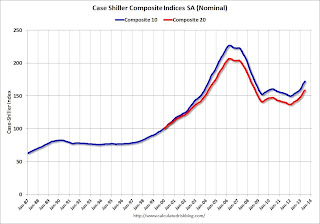
The first graph shows the nominal seasonally adjusted Composite 10 and Composite 20 indices (the Composite 20 was started in January 2000).

The Composite 10 index is off 24.1% from the peak, and up 1.1% in June (SA). The Composite 10 is up 15.1% from the post bubble low set in Jan 2012 (SA).

The Composite 20 index is off 23.4% from the peak, and up 0.9% (SA) in June. The Composite 20 is up 15.7% from the post-bubble low set in Jan 2012 (SA).

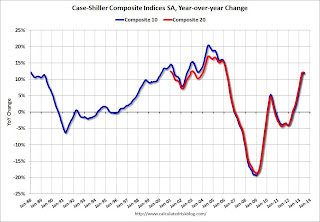
Case-Shiller House Prices Indices The second graph shows the Year over year change in both indices.

The Composite 10 SA is up 11.9% compared to June 2012.

The Composite 20 SA is up 12.1% compared to June 2012. This was the thirteen consecutive month with a year-over-year gain and it appears the YoY change might be starting to slow.

Prices increased (SA) in 15 of the 20 Case-Shiller cities in June seasonally adjusted. Prices in Las Vegas are off 50.2% from the peak, and prices in Denver and Dallas are at new highs.

This was close to the consensus forecast for a 12.2% YoY increase. I'll have more on prices later.

Going Global Translates to a Healthier Bottom Line

iStockphoto/Thinkstock
A study commissioned by HSBC Bank USA and carried out by the Economist Intelligence Unit, looked at globally oriented companies in the Southeast over the past six years.  Here's what it found:  Companies enjoyed profit margins of slightly more than five percentage points above those of their more domestically oriented peers.
Greater global exposure over the rocky recessional years may have made more international firms more resilient,’’ said the study, which analyzed the level of sales and foreign operations among public companies.

Read more here: http://www.miamiherald.com/2013/08/18/3571471/study-going-global-correlates.html#storylink=cpy
So if you are interested in increasing your company’s profit margin, going global may be the way to do it.

Read the entire article here.

Note:  Study cannot be found.

Read more here: http://www.miamiherald.com/2013/08/18/3571471/study-going-global-correlates.html#storylink=cpy


Read more here: http://www.miamiherald.com/2013/08/18/3571471/study-going-global-correlates.html#storylink=cpy

Monday, August 26, 2013

Tuesday: Case-Shiller House Prices, Consumer Confidence, Richmond Fed Mfg Survey

A very disappointing report from CNBC tonight: Obama source predicts Summers will be named Fed chief soon
A source from Team Obama told CNBC that Larry Summers will likely be named chairman of the Federal Reserve in a few weeks though he is "still being vetted" so it might take a little longer.
I don't think Summers is a good choice for Fed Chair.  Also I doubt any delay is because he is still being vetted, more likely they are still trying to find the confirmation votes in the Senate.

Tuesday:
• 9:00 AM ET, S&P/Case-Shiller House Price Index for June. Although this is the June report, it is really a 3 month average of April, May, and June. The consensus is for a 12.2% year-over-year increase in the Composite 20 index (NSA) for June. The Zillow forecast is for the Composite 20 to increase 12.1% year-over-year, and for prices to increase 1.1% month-to-month seasonally adjusted.

• At 10:00 AM, Conference Board's consumer confidence index for August. The consensus is for the index to decrease to 78.0 from 80.3.

• Also at 10:00 AM, Richmond Fed Survey of Manufacturing Activity for August. The consensus is for a reading of 0 for this survey, up from minus 11 in July (Above zero is expansion).

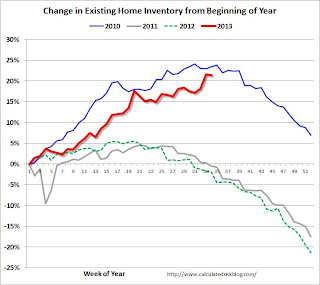
Weekly Update: Existing Home Inventory is up 21.4% year-to-date on Aug 26th

Here is another weekly update on housing inventory: One of key questions for 2013 is Will Housing inventory bottom this year?. Since this is a very important question, I'm tracking inventory weekly in 2013. 

There is a clear seasonal pattern for inventory, with the low point for inventory in late December or early January, and then peaking in mid-to-late summer.

The Realtor (NAR) data is monthly and released with a lag (the most recent data was for July).  However Ben at Housing Tracker (Department of Numbers) has provided me some weekly inventory data for the last several years. This is displayed on the graph below as a percentage change from the first week of the year (to normalize the data).

In 2010 (blue), inventory increased more than the normal seasonal pattern, and finished the year up 7%. However in 2011 and 2012, there was only a small increase in inventory early in the year, followed by a sharp decline for the rest of the year.

Exsiting Home Sales Weekly dataClick on graph for larger image.

Note: the data is a little weird for early 2011 (spikes down briefly).

So far in 2013, inventory is up 21.4%, and there might be some further increases over the next few weeks.  It is important to remember that inventory is still very low, and is down 5.7% from the same week last year according to Housing Tracker.

This strongly suggests inventory bottomed early this year.   I expect inventory to be up year-over-year very soon (maybe in September), and I also expect the seasonal decline to be less than usual at the end of the year.  This increase in inventory also means price increases will slow.

NY Times: "For Laid-Off Older Workers, Age Bias Is Pervasive"

A sad story from Michael Winerip at the NY Times: For Laid-Off Older Workers, Age Bias Is Pervasive
[A] substantial number of older workers who lost jobs — even those lucky enough to be re-employed — are still suffering. Two-thirds in that age group who found work again are making less than they did in their previous job; their median salary loss is 18 percent compared with a 6.7 percent drop for 20- to 24-year-olds.

The re-employment rate for 55- to 64-year-olds is 47 percent and 24 percent for those over 65, compared with 62 percent for 20- to 54-year-olds. And finding another job takes far longer: 46 weeks for boomers, compared with 20 weeks for 16- to 24-year-olds.
I think the age groups that are hit the hardest by a recession are those just entering the workforce, and those nearing retirement.   For those entering the workforce, it is tough to find that first job - and they face a long period of lower wages.  For those who are laid-off nearing retirement, it is very difficult to find a new job and learn new skills ... and the pay is usually substantially less.   

LPS: House Price Index increased 1.2% in June, Up 8.4% year-over-year

Notes: I follow several house price indexes (Case-Shiller, CoreLogic, LPS, Zillow, FHFA, FNC and more). The timing of different house prices indexes can be a little confusing. LPS uses June closings only (not a three month average like Case-Shiller or a weighted average like CoreLogic), excludes short sales and REOs, and is not seasonally adjusted.

From LPS: LPS Home Price Index Report: U.S. Home Prices Up 1.2 Percent for the Month; Up 8.4 Percent Year-Over-Year
Lender Processing Services ... today released its latest LPS Home Price Index (HPI) report, based on June 2013 residential real estate transactions. The LPS HPI combines the company’s extensive property and loan-level databases to produce a repeat sales analysis of home prices as of their transaction dates every month for each of more than 18,500 U.S. ZIP codes. The LPS HPI represents the price of non-distressed sales by taking into account price discounts for REO and short sales.
The LPS HPI is off 15.2% from the peak in June 2006. Note: The press release has data for the 20 largest states, and 40 MSAs. LPS shows prices off 46.6% from the peak in Las Vegas, 37.6% off from the peak in Riverside-San Bernardino, CA (Inland Empire), and at new peaks in Austin, Dallas, Denver and Houston!

Note: Case-Shiller for June will be released tomorrow.

Dallas Fed: "Texas Manufacturing Posts Slower Growth" in August

From the Dallas Fed: Texas Manufacturing Posts Slower Growth
Texas factory activity increased but at a slower pace in August, according to business executives responding to the Texas Manufacturing Outlook Survey. The production index, a key measure of state manufacturing conditions, remained positive but fell from 11.4 to 7.3.

Other measures of current manufacturing activity also indicated slower growth in August. The new orders index was positive for the fourth month in a row, although it moved down from 10.8 to 5.4. The shipments index also posted a fourth consecutive positive reading but slipped 6 points to 11.4. The capacity utilization index fell from 12.2 to 4.6.

Perceptions of broader business conditions improved again in August, with the general business activity and company outlook indexes posting their third consecutive positive readings. The general business activity index edged up from 4.4 to 5.0, and the company outlook index rose from 4.5 to 7.3.

Labor market indicators reflected an increase in hiring but sharply reduced workweeks. The employment index rose 2 points to 11.2, its highest reading in a year. Twenty percent of firms reported hiring new workers compared with 8 percent reporting layoffs. The hours worked index fell 11 points to -9.9, its lowest reading in nearly four years.

Prices and wages rose in August. The raw materials price index came in at 10, down from its previous reading of 15.9 but still indicative of higher input costs than in July. The finished goods price index was positive for the first time since March, rising 5 points to a reading of 4, suggesting selling prices were up from July as well. The wages and benefits index was positive but edged down to 14.5, although the great majority of manufacturers continued to note no change in compensation costs. Looking ahead, 34 percent of respondents anticipate further increases in raw materials prices over the next six months, while 25 percent expect higher finished goods prices.

Expectations regarding future business conditions remained optimistic in August. The indexes of future general business activity and future company outlook showed mixed movements but remained in strongly positive territory. Indexes for future manufacturing activity also remained solidly positive. emphasis added

LPS: Mortgage Delinquency Rate decreases in July

According to the First Look report for July to be released today by Lender Processing Services (LPS), the percent of loans delinquent decreased in July compared to June, and declined about 9% year-over-year. Also the percent of loans in the foreclosure process declined further in July and were down 31% over the last year.

LPS reported the U.S. mortgage delinquency rate (loans 30 or more days past due, but not in foreclosure) decreased to 6.41% from 6.68% in June. Note: Some of the decrease in short term delinquencies in July is seasonal.   The normal rate for delinquencies is around 4.5% to 5%.

The percent of loans in the foreclosure process declined to 2.82% in July from 2.93% in June. 

The number of delinquent properties, but not in foreclosure, is down 327,000 properties, and the number of properties in the foreclosure process is down 636,000 properties year-over-year.

LPS will release the complete mortgage monitor for July in early September.

LPS: Percent Loans Delinquent and in Foreclosure Process
July 2013June 2013July 2012
Delinquent6.41%6.68%7.03%
In Foreclosure2.82%2.93%4.08%
Number of properties:
Number of properties that are 30 or more, and less than 90 days past due, but not in foreclosure:1,846,0001,983,0001,960,000
Number of properties that are 90 or more days delinquent, but not in foreclosure:1,347,0001,345,0001,560,000
Number of properties in foreclosure pre-sale inventory:1,406,0001,458,0002,042,000
Total Properties4,599,0004,785,0005,562,000