This will be a very busy week for economic data. The key reports this week are the Q2 advance GDP report on Wednesday, and the July employment report on Friday.
Other key reports include the ISM manufacturing index on Thursday, auto sales also on Tuesday, and Case-Shiller house prices for May on Tuesday. The June Personal Income and Outlays report will be released on Friday.
Also there is an FOMC meeting on Tuesday and Wednesday. Overseas, the ECB and BOE will hold monetary policy meetings, and China's PMI will be released.
----- Monday, July 29th -----10:00 AM ET:
Pending Home Sales Index for June. The consensus is for a 1.4% decrease in the index.
10:30 AM:
Dallas Fed Manufacturing Survey for July. This is the last of the regional manufacturing surveys for July. The consensus is a reading of 6.4, mostly unchanged from the reading of 6.5 in June (above zero is expansion).
----- Tuesday, July 30th -----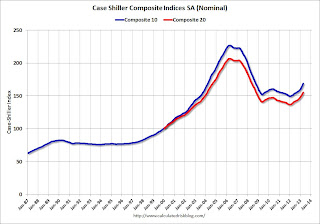
9:00 AM:
S&P/Case-Shiller House Price Index for May. Although this is the May report, it is really a 3 month average of March, April and May.
This graph shows the nominal seasonally adjusted Composite 10 and Composite 20 indexes through April 2012 (the Composite 20 was started in January 2000).
The consensus is for a 12.3% year-over-year increase in the Composite 20 index (NSA) for May. The
Zillow forecast is for the Composite 20 to increase 12.1% year-over-year, and for prices to increase 1.3% month-to-month seasonally adjusted.
10:00 AM:
Conference Board's consumer confidence index for July. The consensus is for the index to decrease to 81.0 from 81.4.
10:00 AM:
Q2 Housing Vacancies and Homeownership report from the Census Bureau. This report is frequently mentioned by analysts and the media to report on the homeownership rate, and the homeowner and rental vacancy rates. However, this report doesn't track with other measures (like the decennial Census and the ACS) and this survey probably shouldn't be used to estimate the excess vacant housing supply.
----- Wednesday, July 31st -----7:00 AM: The Mortgage Bankers Association (MBA) will release the results for the
mortgage purchase applications index.
8:15 AM: The
ADP Employment Report for July. This report is for private payrolls only (no government). The consensus is for 179,000 payroll jobs added in July, down from 188,000 in June.
8:30 AM:
Q2 GDP (advance estimate). This is the advance estimate of Q2 GDP from the BEA. The consensus is that real GDP increased 1.1% annualized in Q2. This report will includes a Comprehensive Revision from 1929 through 1st quarter 2013.
9:45 AM:
Chicago Purchasing Managers Index for July. The consensus is for an increase to 54.0, up from 51.6 in June.
2:00 PM:
FOMC Meeting Announcement. No change to interest rates or QE purchases is expected at this meeting.
----- Thursday, Aug 1st -----8:30 AM: The
initial weekly unemployment claims report will be released. The consensus is for an increase to 345 thousand from 343 thousand last week.
All day:
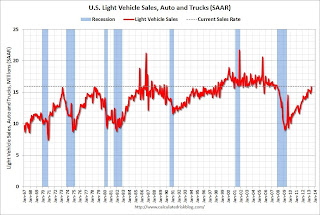
Light vehicle sales for July. The consensus is for light vehicle sales to decrease to 15.8 million SAAR in July (Seasonally Adjusted Annual Rate) from 15.9 million SAAR in June.
This graph shows light vehicle sales since the BEA started keeping data in 1967. The dashed line is the June sales rate.
9:00 AM: The
Markit US PMI Manufacturing Index for July. The consensus is for the index to increase to 53.1 from 51.9 in June.
10:00 AM ET:
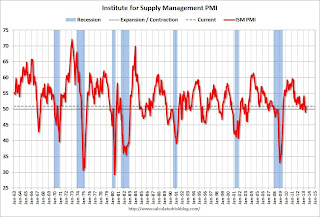
ISM Manufacturing Index for July. The consensus is for an increase to 53.1 from 50.9 in June. Based on the regional surveys, an increase in July seems likely.
Here is a long term graph of the ISM manufacturing index.
The ISM manufacturing index indicated expansion in June at 50.9%. The employment index was at 48.7%, and the new orders index was at 51.9%.
10:00 AM:
Construction Spending for June. The consensus is for a 0.4% increase in construction spending.
----- Friday, Aug 2nd -----8:30 AM:
Employment Report for July. The consensus is for an increase of 175,000 non-farm payroll jobs in July; the economy added 195,000 non-farm payroll jobs in June.
The consensus is for the unemployment rate to decrease to 7.5% in July from 7.6% in June.
The following graph shows the percentage of payroll jobs lost during post WWII recessions through June.
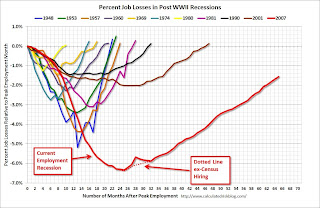
The economy has added 7.2 million private sector jobs since employment bottomed in February 2010 (6.6 million total jobs added including all the public sector layoffs).
There are still 1.6 million fewer private sector jobs now than when the recession started in 2007.
8:30 AM ET:
Personal Income and Outlays for June. The consensus is for a 0.4% increase in personal income in June, and for a 0.4% increase in personal spending. And for the Core PCE price index to increase 0.1%.
10:00 AM:
Manufacturers' Shipments, Inventories and Orders (Factory Orders) for June. The consensus is for a 2.3% increase in orders.
 Click on graph for larger image.


