In April 2012, Treasury released a slide deck titled Financial Crisis Response In Charts. One of the charts shows the percentage jobs lost in the current recession compared to the Great Depression.
Here is that graph (I've modified the graph slightly and added a few dots to update the current recession).
 Click on graph for larger image.
 This graph compares the job losses from the start of the employment recession, in percentage terms for the Great Depression, the 2007 recession, and the average for several recent recession following financial crisis.
Although the 2007 recession is much worse than any other post-war recession, the employment impact was much less than during the Depression. Note the second dip during the Depression - that was in 1937 and the result of austerity measures.
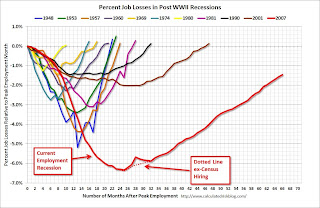
 For reference, the second graph shows the job losses from the start of the employment recession through July, in percentage terms, compared to other post WWII recessions.
 The Great Depression would be "off the chart".
No comments:
Post a Comment