This release includes prices for 20 individual cities, two composite indices (for 10 cities and 20 cities) and the Q1 national index.
Note: Case-Shiller reports Not Seasonally Adjusted (NSA), I use the SA data for the graphs.
From S&P: Home Prices See Strong Gains in the First Quarter of 2013 According to the S&P/Case-Shiller Home Price Indices
Data through March 2013, released today by S&P Dow Jones Indices for its S&P/Case-Shiller Home Price Indices ... showed that all three composites posted double-digit annual increases. The 10-City and 20-City Composites increased by 10.3% and 10.9% in the year to March with the national composite rising by 10.2% in the last four quarters. All 20 cities posted positive year-over-year growth.
In the first quarter of 2013, the national composite rose by 1.2%. On a monthly basis, the 10- and 20-City Composites both posted increases of 1.4%. Charlotte, Los Angeles, Portland, Seattle and Tampa were the five MSAs to record their largest month-over-month gains in over seven years.
“Home prices continued to climb,” says David M. Blitzer, Chairman of the Index Committee at S&P Dow Jones Indices. “Home prices in all 20 cities posted annual gains for the third month in a row. Twelve of the 20 saw prices rise at double-digit annual growth. The National Index and the 10- and 20-City Composites posted their highest annual returns since 2006.
“Phoenix again had the largest annual increase at 22.5% followed by San Francisco with 22.2% and Las Vegas with 20.6%. Miami and Tampa, the eastern end of the Sunbelt, were softer with annual gains of 10.7% and 11.8%. The weakest annual price gains were seen in New York (+2.6%), Cleveland (+4.8%) and Boston (+6.7%); even these numbers are quite substantial.
 Click on graph for larger image.
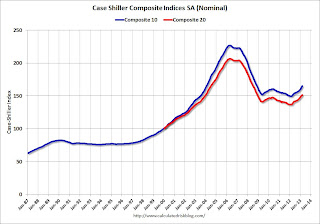
 The first graph shows the nominal seasonally adjusted Composite 10 and Composite 20 indices (the Composite 20 was started in January 2000).
The Composite 10 index is off 27.3 % from the peak, and up 1.5% in March (SA). The Composite 10 is up 10.3% from the post bubble low set in Jan 2012 (SA).
The Composite 20 index is off 26.6% from the peak, and up 1.3% (SA) in March. The Composite 20 is up 10.9% from the post-bubble low set in Jan 2012 (SA).
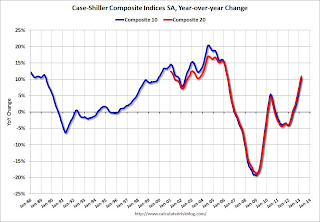
 The second graph shows the Year over year change in both indices.
The Composite 10 SA is up 10.2% compared to March 2012.
The Composite 20 SA is up 10.9% compared to March 2012. This was the tenth consecutive month with a year-over-year gain and this was the largest year-over-year gain for the Composite 20 index since 2006.
Prices increased (SA) in 20 of the 20 Case-Shiller cities in March seasonally adjusted. Prices in Las Vegas are off 53.6% from the peak, and prices in Denver only off 0.1% from the peak.
This was above the consensus forecast for a 10.2% YoY increase. I'll have more on prices later.
No comments:
Post a Comment