Personal consumption expenditure (PCE) grew at a 3.4% annualized real rate in Q1, revised up from 3.2%.
The change in private inventories was revised down to a 0.63 percentage point contribution from a 1.03 percentage point contribution in the advance report (a 0.40 percentage point decline between estimates). This smaller buildup in inventories for Q1 is probably a positive for Q2.
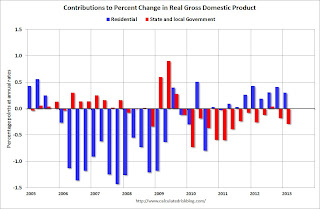
A key negative was the contribution from state and local government from -0.14 percentage points to -0.29 percentage points - the largest drag since Q2 2011.
This graph shows the contribution to percent change in GDP for residential investment and state and local governments since 2005.
 Click on graph for larger image.
The blue bars are for residential investment (RI), and RI was a significant drag on GDP for several years - and is now adding to the economy.
However the drag from state and local governments has continued. Just ending this drag will be a positive for the economy. Note: In real terms, state and local government spending is at the lowest level since Q1 2001.
With consumer spending holding up, residential investment increasing - and state and local governments near the bottom - this suggests decent growth going forward. Of course there will be a substantial drag from Federal fiscal policy over the next couple of quarters ...
No comments:
Post a Comment