“Three straight months of national home value appreciation above 10 percent is not normal, not sustainable and, frankly, not very believable. As the overall housing market continues to improve, the impact of foreclosure re-sales on the Case-Shiller indices continues to be pronounced, as homes previously sold under duress trade again under more normal circumstances, leading to inflated and misleading markups in price,” said Zillow Senior Economist Svenja Gudell. “It’s increasingly critical that the average American homeowner not read numbers like today’s Case-Shiller results and assume their homes must also have appreciated at these levels over the past year, or will continue to appreciate at these levels going forward. In reality, typical home values have appreciated at roughly half this pace for the past several months, which is still very robust. Looking ahead, a combination of rising mortgage interest rates, flagging investor demand and more inventory entering the market will all help to moderate the pace of home value appreciation and stabilize the market.”I agree with Gudell on these two key points: 1) I also think right now the Case-Shiller index is overstating price increases for most homeowners (both because of the handling of distressed sales and weighting of some coastal areas), and 2) I also think price appreciation will slow going forward.
emphasis added
I also think it is important to look at prices in real terms (inflation adjusted). Case-Shiller, CoreLogic and others report nominal house prices. As an example, if a house price was $200,000 in January 2000, the price would be close to $275,000 today adjusted for inflation.
Earlier: Case-Shiller: Case-Shiller: Comp 20 House Prices increased 12.2% year-over-year in May
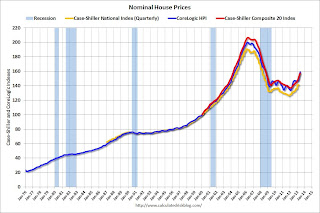
Nominal House Prices
 The first graph shows the quarterly Case-Shiller National Index SA (through Q1 2013), and the monthly Case-Shiller Composite 20 SA and CoreLogic House Price Indexes (through May) in nominal terms as reported.
In nominal terms, the Case-Shiller National index (SA) is back to Q3 2003 levels (and also back up to Q4 2008), and the Case-Shiller Composite 20 Index (SA) is back to March 2004 levels, and the CoreLogic index (NSA) is back to May 2004.
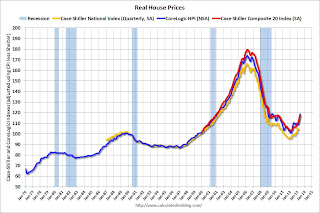
Real House Prices
 The second graph shows the same three indexes in real terms (adjusted for inflation using CPI less Shelter). Note: some people use other inflation measures to adjust for real prices.
In real terms, the National index is back to Q2 2000 levels, the Composite 20 index is back to October 2001, and the CoreLogic index back to February 2002.
In real terms, house prices are back to early '00s levels.
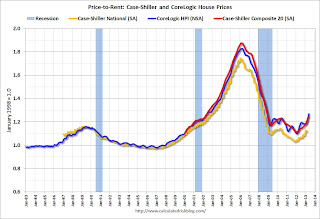
Price-to-Rent
In October 2004, Fed economist John Krainer and researcher Chishen Wei wrote a Fed letter on price to rent ratios: House Prices and Fundamental Value. Kainer and Wei presented a price-to-rent ratio using the OFHEO house price index and the Owners' Equivalent Rent (OER) from the BLS.
 Here is a similar graph using the Case-Shiller National, Composite 20 and CoreLogic House Price Indexes.
This graph shows the price to rent ratio (January 1998 = 1.0).
On a price-to-rent basis, the Case-Shiller National index is back to Q2 2000 levels, the Composite 20 index is back to April 2002 levels, and the CoreLogic index is back to June 2002.
In real terms - and as a price-to-rent ratio - prices are mostly back to early 2000 levels.
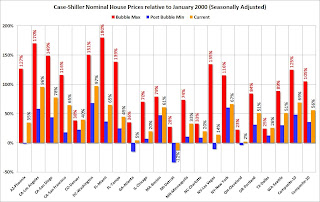
Nominal Prices: Cities relative to Jan 2000
 The last graph shows the bubble peak, the post bubble minimum, and current nominal prices relative to January 2000 prices for all the Case-Shiller cities in nominal terms.
As an example, at the peak, prices in Phoenix were 127% above the January 2000 level. Then prices in Phoenix fell slightly below the January 2000 level, and are now up 35% above January 2000. Two cities - Denver and Dallas - are at new highs (no other Case-Shiller Comp 20 city is close). Detroit prices are still below the January 2000 level.
No comments:
Post a Comment