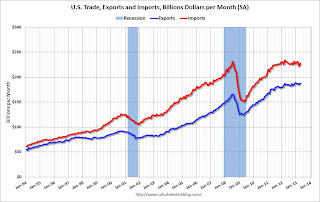
[T]otal April exports of $187.4 billion and imports of $227.7 billion resulted in a goods and services deficit of $40.3 billion, up from $37.1 billion in March, revised. April exports were $2.2 billion more than March exports of $185.2 billion. April imports were $5.4 billion more than March imports of $222.3 billion..The trade deficit was lower than the consensus forecast of $41.2 billion.
The first graph shows the monthly U.S. exports and imports in dollars through April 2013.
 Click on graph for larger image.
Both exports and imports increased in April. Imports rebounded from the decline in March that was partially due to the timing of the Chinese New Year.
Exports are 13% above the pre-recession peak and up 2% compared to April 2012; imports are 2% below the pre-recession peak, and down 1% compared to April 2012 (mostly moving sideways).
The second graph shows the U.S. trade deficit, with and without petroleum, through April.
 The blue line is the total deficit, and the black line is the petroleum deficit, and the red line is the trade deficit ex-petroleum products. Most of the recent improvement in the trade deficit is related to petroleum.
Oil averaged $97.82 in April, up from $96.95 per barrel in March, but down from $109.69 in April 2012. Oil import prices should decline in May.
The trade deficit with the euro area was $10.0 billion in April, up from $7.8 billion in April 2012.
The trade deficit with China decreased to $24.1 billion in April, down from $24.5 billion in April 2012. Most of the trade deficit is related to China.
No comments:
Post a Comment