Wednesday, December 11, 2013

Duty Free Model is Going Global

iStock/Thinkstock
Qatar Duty Free is preparing to expand internationally, with Senior Vice President Keith Hunter saying the company will look at opportunities around the world.
“We’ll [says Hunter] be looking all around the world [for] any opportunities where it may be a business opportunity for us or a partnership or an association.”
Read the entire article: Qatar Duty Free Signals Ambitions For International Expansion

MBA: Mortgage Applications Increase in Latest Survey

From the MBA: Mortgage Applications Fall During Holiday-Shortened Week
Mortgage applications increased 1.0 percent from one week earlier, according to data from the Mortgage Bankers Association’s (MBA) Weekly Mortgage Applications Survey for the week ending December 6, 2013. The previous week’s results included an adjustment for the Thanksgiving holiday. ...

The Refinance Index increased 2 percent from the previous week and was 16 percent lower than the week prior to Thanksgiving. The seasonally adjusted Purchase Index increased 1 percent from one week earlier and was 3 percent lower than the week prior to Thanksgiving. ...
...
The average contract interest rate for 30-year fixed-rate mortgages with conforming loan balances ($417,000 or less) increased to 4.61 percent, the highest rate since September, from 4.51 percent, with points decreasing to 0.26 from 0.38 (including the origination fee) for 80 percent loan-to-value ratio (LTV) loans.
emphasis added
Mortgage Purchase Index Click on graph for larger image.


The first graph shows the refinance index.

The refinance index is down sharply - and down 68% from the levels in early May.


Mortgage Refinance IndexThe second graph shows the MBA mortgage purchase index.  

The 4-week average of the purchase index is now down about 8% from a year ago.

Note: It appears these small independent lenders (not included in the MBA survey) are focusing on the purchase market.  A result of this change in market share is the Purchase Index is probably understating the increase in purchase activity.

Tuesday, December 10, 2013

Update: Budget Deal is Reached

Some good news ...

From the NY Times: Congressional Negotiators Reach Budget Deal
The agreement eliminates about $65 billion in across-the-board domestic and defense cuts while adding an additional $25 billion in deficit reduction by extending a 2 percent cut to Medicare through 2022 and 2023, two years beyond the cuts set by the Budget Control Act of 2011.
...
Under the agreement, military and domestic spending for the current fiscal year that is under the annual discretion of Congress would rise to just over $1 trillion, from the $967 billion level it would hit if spending cuts known as sequestration were imposed next month. Spending would be capped at $1 trillion in fiscal year 2015 as well.
And from the WSJ: House, Senate Negotiators Announce Budget Deal
Revenues to fund the higher spending would come from changes to federal employee and military pension programs, and higher fees for airline passengers, among other sources. An extension of long-term unemployment benefits, sought by Democrats, wasn't included.
In 2013, the key downside risk to the economy was Congress (specifically the House), and unfortunately they delivered. Hopefully this eliminates that risk for 2014.

On the economics, the sequester cuts were a disaster (they probably hurt the economy more than it helped reduce the deficit), so reducing the sequester cuts for 2014 is a positive. I'd like to see an extension of emergency unemployment benefits for another 6 months or a year, but that isn't included in this deal.

The bottom line: Although this deal was expected (and I expect the bill to pass), this is another reason to be optimistic about 2014. Also - even though Fed officials will deny it - I think this increases the odds of the Fed tapering in December or January 2014.

Lawler: Preliminary Table of Distressed Sales and Cash buyers for Selected Cities in November

Economist Tom Lawler sent me the preliminary table below of short sales, foreclosures and cash buyers for several selected cities in November.  First, from Lawler on November sales:
"While I do not have enough reports to produce an accurate estimate of existing home sales for November, reports I’ve seen so far suggest that home sales declined again on a seasonally adjusted basis last month."
From CR: This is just a few markets, but total "distressed" share is down significantly, mostly because of a decline in short sales.  Foreclosure are down in most areas too.


The All Cash Share (last two columns) is mostly declining year-over-year.  As investors pull back in markets the share of all cash buyers will probably decline.

In general it appears the housing market is slowly moving back to normal.

Short Sales ShareForeclosure Sales Share Total "Distressed" ShareAll Cash Share
Nov-13Nov-12Nov-13Nov-12Nov-13Nov-12Nov-13Nov-12
Las Vegas21.0%41.2%7.0%10.7%28.0%51.9%43.7%52.7%
Reno17.0%41.0%6.0%9.0%23.0%50.0%
Phoenix7.8%23.2%8.0%12.9%15.8%36.1%
Mid-Atlantic 7.5%11.9%8.1%8.7%15.7%20.6%19.6%20.0%
Tucson32.2%33.8%
Toledo37.2%40.9%
Omaha21.6%19.8%
Spokane16.0%9.1%
Memphis*20.4%24.4%
Springfield IL17.0%15.8%
*share of existing home sales, based on property records

Public and Private Sector Payroll Jobs: Reagan, Bush, Clinton, Bush, Obama

By request, here is an update on an earlier post through the November employment report.

In April, I posted two graphs comparing changes in public and private sector payrolls during the Bush and Obama presidencies. Several readers asked if I could add Presidents Reagan and Clinton (I've also added the single term of President George H.W. Bush).  Below are updates through the September report.

Important: There are many differences between these periods. Overall employment was smaller in the '80s, so a different comparison might be to look at the percentage change.   Of course the participation rate was increasing in the '80s (younger population and women joining the labor force), and the participation rate is declining now.  But these graphs give an overview of employment changes.

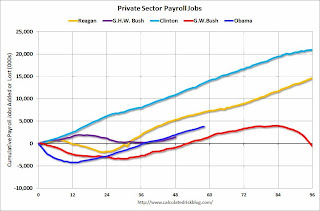
The first graph shows the change in private sector payroll jobs from when each president took office until the end of their term(s).  President George H.W. Bush only served one term, and President Obama is in the first year of his second term. 

Mr. G.W. Bush (red) took office following the bursting of the stock market bubble, and left during the bursting of the housing bubble.  Mr. Obama (blue) took office during the financial crisis and great recession.  There was also a significant recession in the early '80s right after Mr. Reagan (yellow) took office.

There was a recession towards the end of President G.H.W. Bush (purple) term, and Mr Clinton (light blue) served for eight years without a recession.
Private Sector Payrolls Click on graph for larger image.

The first graph is for private employment only.

The employment recovery during Mr. G.W. Bush's (red) first term was very sluggish, and private employment was down 946,000 jobs at the end of his first term.   At the end of Mr. Bush's second term, private employment was collapsing, and there were net 665,000 private sector jobs lost during Mr. Bush's two terms. 

Private sector employment increased slightly under President G.H.W. Bush (purple), with 1,490,000 private sector jobs added.

Private sector employment increased by 20,864,000 under President Clinton (light blue) and 14,688,000 under President Reagan (yellow).

There were only 1,933,000 more private sector jobs at the end of Mr. Obama's first term.  At this early point in Mr. Obama's second term, there are now 3,860,000 more private sector jobs than when he initially took office.
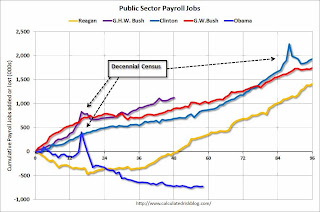
Public Sector Payrolls A big difference between the presidencies has been public sector employment.  Note the bumps in public sector employment due to the decennial Census in 1990, 2000, and 2010. 

The public sector grew during Mr. Reagan's terms (up 1,414,000), during Mr. G.H.W. Bush's term (up 1,127,000), during Mr. Clinton's terms (up 1,934,000), and during Mr. G.W. Bush's terms (up 1,748,000 jobs).

However the public sector has declined significantly since Mr. Obama took office (down 726,000 jobs). These job losses have mostly been at the state and local level, but more recently at the Federal level.  This has been a significant drag on overall employment.

Looking forward, I expect the economy to continue to expand for the next few years, so I don't expect a sharp decline in employment as happened at the end of Mr. Bush's 2nd term (In 2005 and 2006 I was warning of a coming recession due to the bursting of the housing bubble).

A big question is when the public sector layoffs will end.  It appears the cutbacks are mostly over at the state and local levels, but there are ongoing cutbacks at the Federal level - but overall public employment will probably start increasing soon.

Las Vegas Real Estate in November: Year-over-year Non-contingent Inventory up 77.4%

This is a key distressed market to follow since Las Vegas has seen the largest price decline of any of the Case-Shiller composite 20 cities.

The Greater Las Vegas Association of Realtors reported GLVAR reports home prices, sales, supply dip heading into holidays
GLVAR said the total number of existing local homes, condominiums and townhomes sold in November was 2,694. That’s down from 3,192 in October and down from 3,293 total sales in November 2012. Compared to October, single-family home sales during November decreased by 16.2 percent, while sales of condos and townhomes decreased by 12.7 percent. Compared to one year ago, single-family home sales were down 17.9 percent, while condo and townhome sales were down 19.3 percent. ...
...
In November, 21 percent of all existing home sales were short sales, unchanged from October. Another 7 percent of all November sales were bank-owned properties, up from 6 percent in October. The remaining 72 percent of all sales were the traditional type, down from 73 percent in October.
...
The total number of properties listed for sale on GLVAR’s Multiple Listing Service decreased in November, with 14,240 single-family homes listed for sale at the end of the month. That’s down 5.1 percent from 15,011 single-family homes listed for sale at the end of October and down 8.9 percent from one year ago. ...

By the end of November, GLVAR reported 6,830 single-family homes listed without any sort of offer. That’s down 3.4 percent from 7,072 such homes listed in October, but still up 77.4 percent from one year ago. For condos and townhomes, the 2,192 properties listed without offers in November represented a 2.4 percent decrease from 2,247 such properties listed in October, but an 80.0 percent increase from one year ago.
emphasis added
There are several key trends that we've been following:

1) Sales were down again in November, and down about 17.9% year-over-year.

2) Conventional sales are up solidly.  In November 2012, only 48.1% of all sales were conventional.  This year, in November 2013, 72.0% were conventional.  That is an increase in conventional sales of about 23% year-over-year.

3)  Most distressed sales are short sales instead of foreclosures (3 to 1).  Both foreclosures and short sales are down sharply year-over-year.

4) and most interesting right now is that non-contingent inventory (year-over-year) is now increasing rapidly.  Non-contingent inventory is up 77.4% year-over-year!

Inventory has clearly bottomed in Las Vegas (A major theme for housing in 2013).  And fewer distressed sales and more inventory means price increases will slow.

BLS: Job Openings "little changed" in October

From the BLS: Job Openings and Labor Turnover Summary
There were 3.9 million job openings on the last business day of October, little changed from September, the U.S. Bureau of Labor Statistics reported today. The hires rate (3.3 percent) and separations rate (3.1 percent) were also little changed in October. ...
...
Quits are generally voluntary separations initiated by the employee. Therefore, the quits rate can serve as a measure of workers’ willingness or ability to leave jobs. Layoffs and discharges are involuntary separations initiated by the employer. ... The number of quits (not seasonally adjusted) increased over the 12 months ending in October for total nonfarm and total private and was little changed for government.
The following graph shows job openings (yellow line), hires (dark blue), Layoff, Discharges and other (red column), and Quits (light blue column) from the JOLTS.

This series started in December 2000.

Note: The difference between JOLTS hires and separations is similar to the CES (payroll survey) net jobs headline numbers. This report is for October, the most recent employment report was for November.

Job Openings and Labor Turnover Survey Click on graph for larger image.

Notice that hires (dark blue) and total separations (red and light blue columns stacked) are pretty close each month. This is a measure of turnover.  When the blue line is above the two stacked columns, the economy is adding net jobs - when it is below the columns, the economy is losing jobs.

Jobs openings increased in October to 3.925 million from 3.883 million in September.  The number of job openings (yellow) is up 7.7% year-over-year compared to October 2012 and openings are at the highest level since early 2008.

Quits increase in October and are up about 14.7% year-over-year. These are voluntary separations. (see light blue columns at bottom of graph for trend for "quits").  This is the highest level for quits since 2008.

Not much changes month-to-month in this report - and the data is noisy month-to-month, but the general trend suggests a gradually improving labor market.  It is a good sign that job openings and quits (voluntary separations) are both at the highest level since 2008.